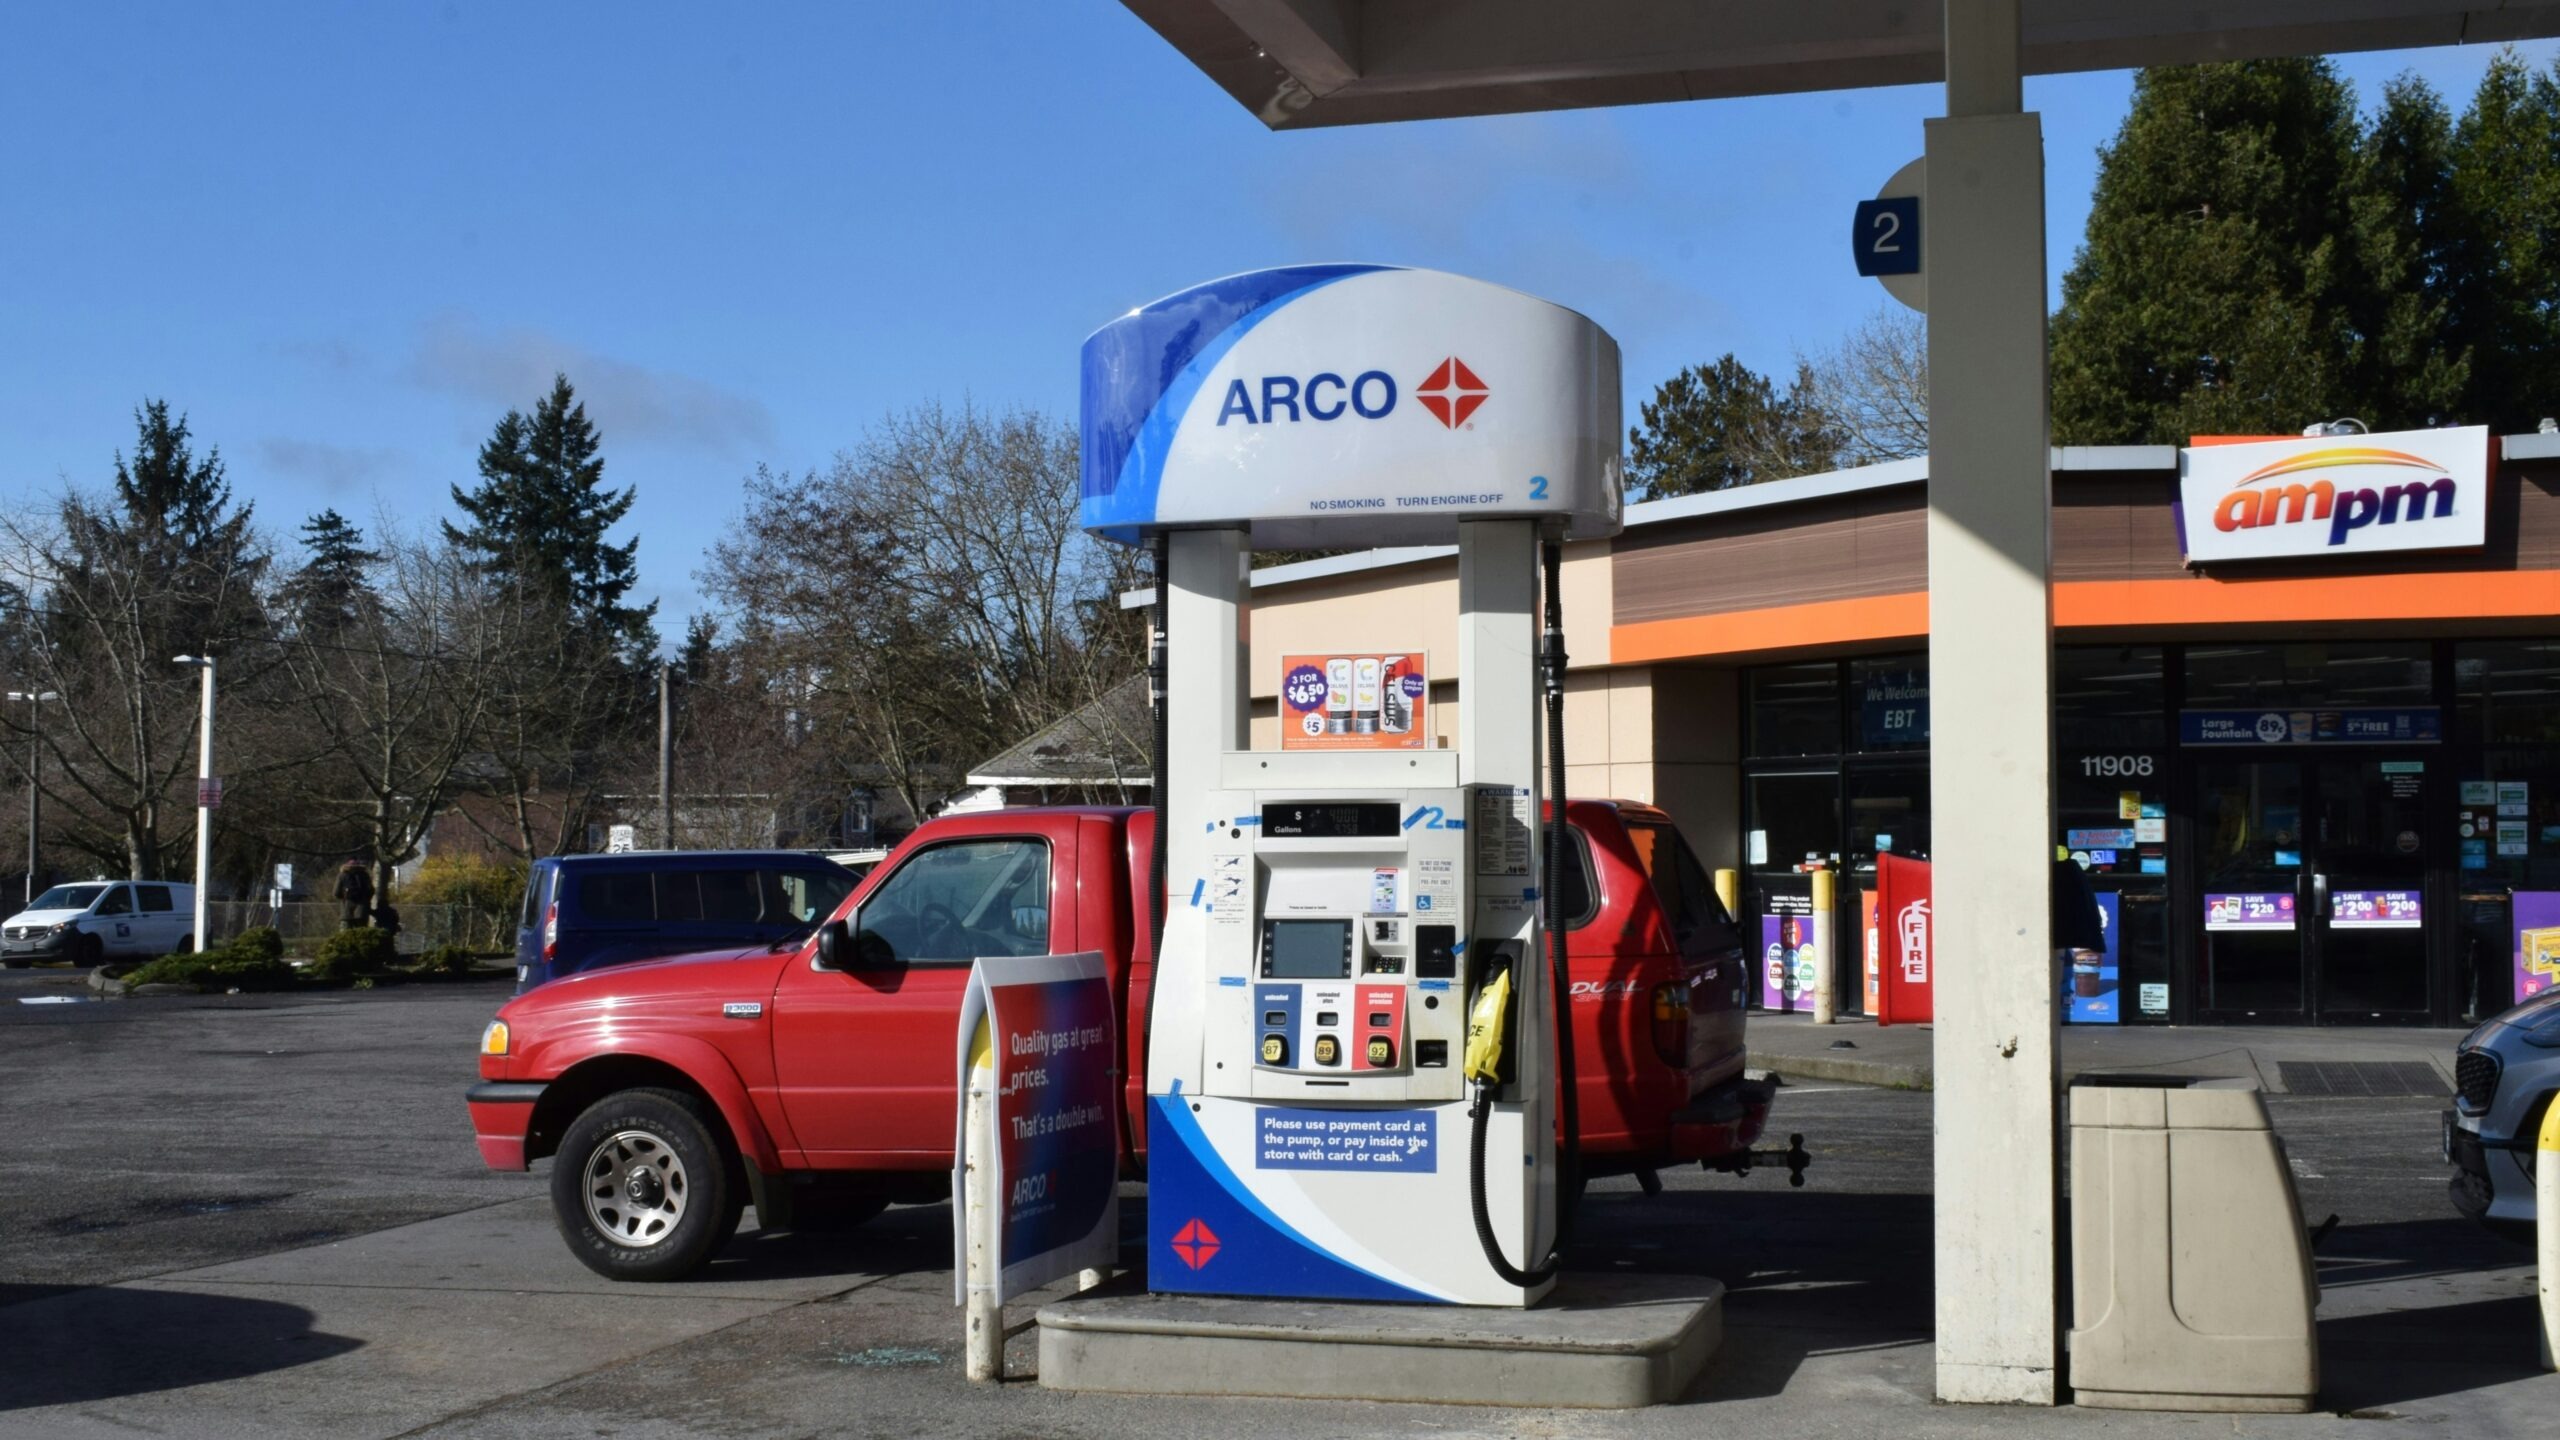
Filling up a sedan in Los Angeles now costs north of $75. In Honolulu, it is closer to $80. Across the country, the national average price of regular gasoline climbed 25 cents in a single week to $4.55 a gallon, according to the U.S. Energy Information Administration’s weekly retail price survey. Six states are now above $5. And the price jump arrived during the same stretch that Brent crude, the global oil benchmark, slipped below $98 a barrel for the first time since March, based on ICE Futures settlement data.
Cheaper oil is supposed to mean cheaper gas. Right now, it does not. The reason sits squarely between the oil well and the pump: American refineries.
Why crude is falling and gas keeps climbing
Oil benchmarks move on global forces: OPEC output decisions, demand signals from China and Europe, shifts in strategic reserve policy. Gasoline prices at your local station respond to a narrower, more immediate set of pressures, and the most important one is refinery throughput, the volume of crude that U.S. refineries actually convert into finished gasoline each week.
The EIA’s Weekly Petroleum Status Report tracks the key supply-side indicators: gasoline stocks, refinery utilization rates, and product supplied as a proxy for consumer demand. When utilization dips or inventories tighten, wholesale gasoline prices can climb even as the cost of crude drops. That is the pattern playing out in late May and early June 2026.
The metric that captures this divergence most precisely is the crack spread, the difference between the price of crude oil and the wholesale price of the refined products (gasoline, diesel) that come out of it. When refinery output falls short of demand, crack spreads widen, meaning refiners and wholesalers command a larger margin on every gallon even as the raw material gets cheaper. Wider crack spreads flow directly into higher prices at the pump.
Right now, refineries entering scheduled summer turnarounds and contending with unplanned outages are reducing the flow of finished fuel into the market at the worst possible moment, just as seasonal driving demand accelerates. The EIA has noted that limited spare refining capacity in the U.S. means even modest disruptions can draw down inventories quickly and push wholesale and retail prices higher. With domestic refineries already running near capacity for much of the spring, there is very little cushion to absorb surprises.
The six states above $5
California, Hawaii, Nevada, Washington, Oregon, and Alaska have all crossed the $5 threshold, according to AAA’s daily state-level price surveys. Together, these states are home to roughly 60 million people. The reasons for their elevated prices vary, but they share common threads.
California and Hawaii have long led the nation in fuel costs. California’s cap-and-trade program, among the highest state excise taxes in the country, and a refining market largely isolated from the rest of the U.S. create a pricing floor well above the national average. Hawaii imports nearly all of its refined fuel by tanker, adding significant transportation costs on top of already elevated wholesale prices.
Nevada, Washington, and Oregon are tightly linked to West Coast refining infrastructure. When a single facility on the Pacific coast goes down for maintenance or an unplanned repair, the supply squeeze ripples across all three states within days. Alaska faces a different version of the same problem: a small, geographically isolated fuel distribution network, limited local refining capacity, and high transportation costs that make its market similarly vulnerable to price spikes that would barely register along the Gulf Coast or in the Midwest.
For households in these states, the practical impact is blunt: fuel costs roughly 10 percent or more above the national average, a gap that tends to widen during refinery maintenance seasons and narrow only slowly afterward.
What federal data can and cannot explain
The EIA’s weekly datasets remain the most reliable public source for national average prices, inventory levels, and refinery utilization. They draw on mandatory reporting from refiners, wholesalers, and retailers across the country, making them far more comprehensive than voluntary surveys or spot-price snapshots.
But the federal data has blind spots. Refinery operators rarely disclose the specific reasons for reduced throughput, whether planned turnarounds, equipment failures, or staffing shortages, until well after the fact. Analysts can infer causes from timing and regional patterns, but definitive explanations often lag by weeks. That gap matters because it leaves drivers, policymakers, and journalists working with incomplete information during the very weeks when prices are moving fastest.
The precise trigger for Brent’s slide below $98 is similarly unsettled. Market commentary points to a combination of softening global demand forecasts and expectations around upcoming OPEC production decisions, but no single authoritative source has published a definitive breakdown for this particular move. The direction of crude is clear; the proportional causes are still being sorted out.
How long the pain could last in the hardest-hit states
Analysts generally estimate that the lag between a sustained drop in crude prices and a corresponding decline at the pump runs four to six weeks. That timeline reflects the time it takes for cheaper crude to work through refinery processing, wholesale distribution, and finally retail pricing.
Whether that window holds through June 2026 depends almost entirely on refinery performance over the next several weeks. If utilization rates climb back toward seasonal norms and no major outages occur, gasoline inventories should begin to rebuild, easing wholesale prices and eventually pulling retail costs lower. If additional refinery disruptions hit during peak demand, the current disconnect between crude and gasoline could persist well into July.
For drivers in the six states already above $5, the math is even less forgiving. West Coast and island markets tend to be the last to see relief when national prices decline and the first to spike when anything goes wrong. Watching Brent crude alone will not tell you when your local station will drop its price. The more useful number to track is the EIA’s weekly gasoline inventory figure, the clearest public signal of whether supply is catching up to demand. When that number starts climbing for two or three consecutive weeks, cheaper gas is likely on the way. Until then, the pump price and the crude price will keep telling very different stories.