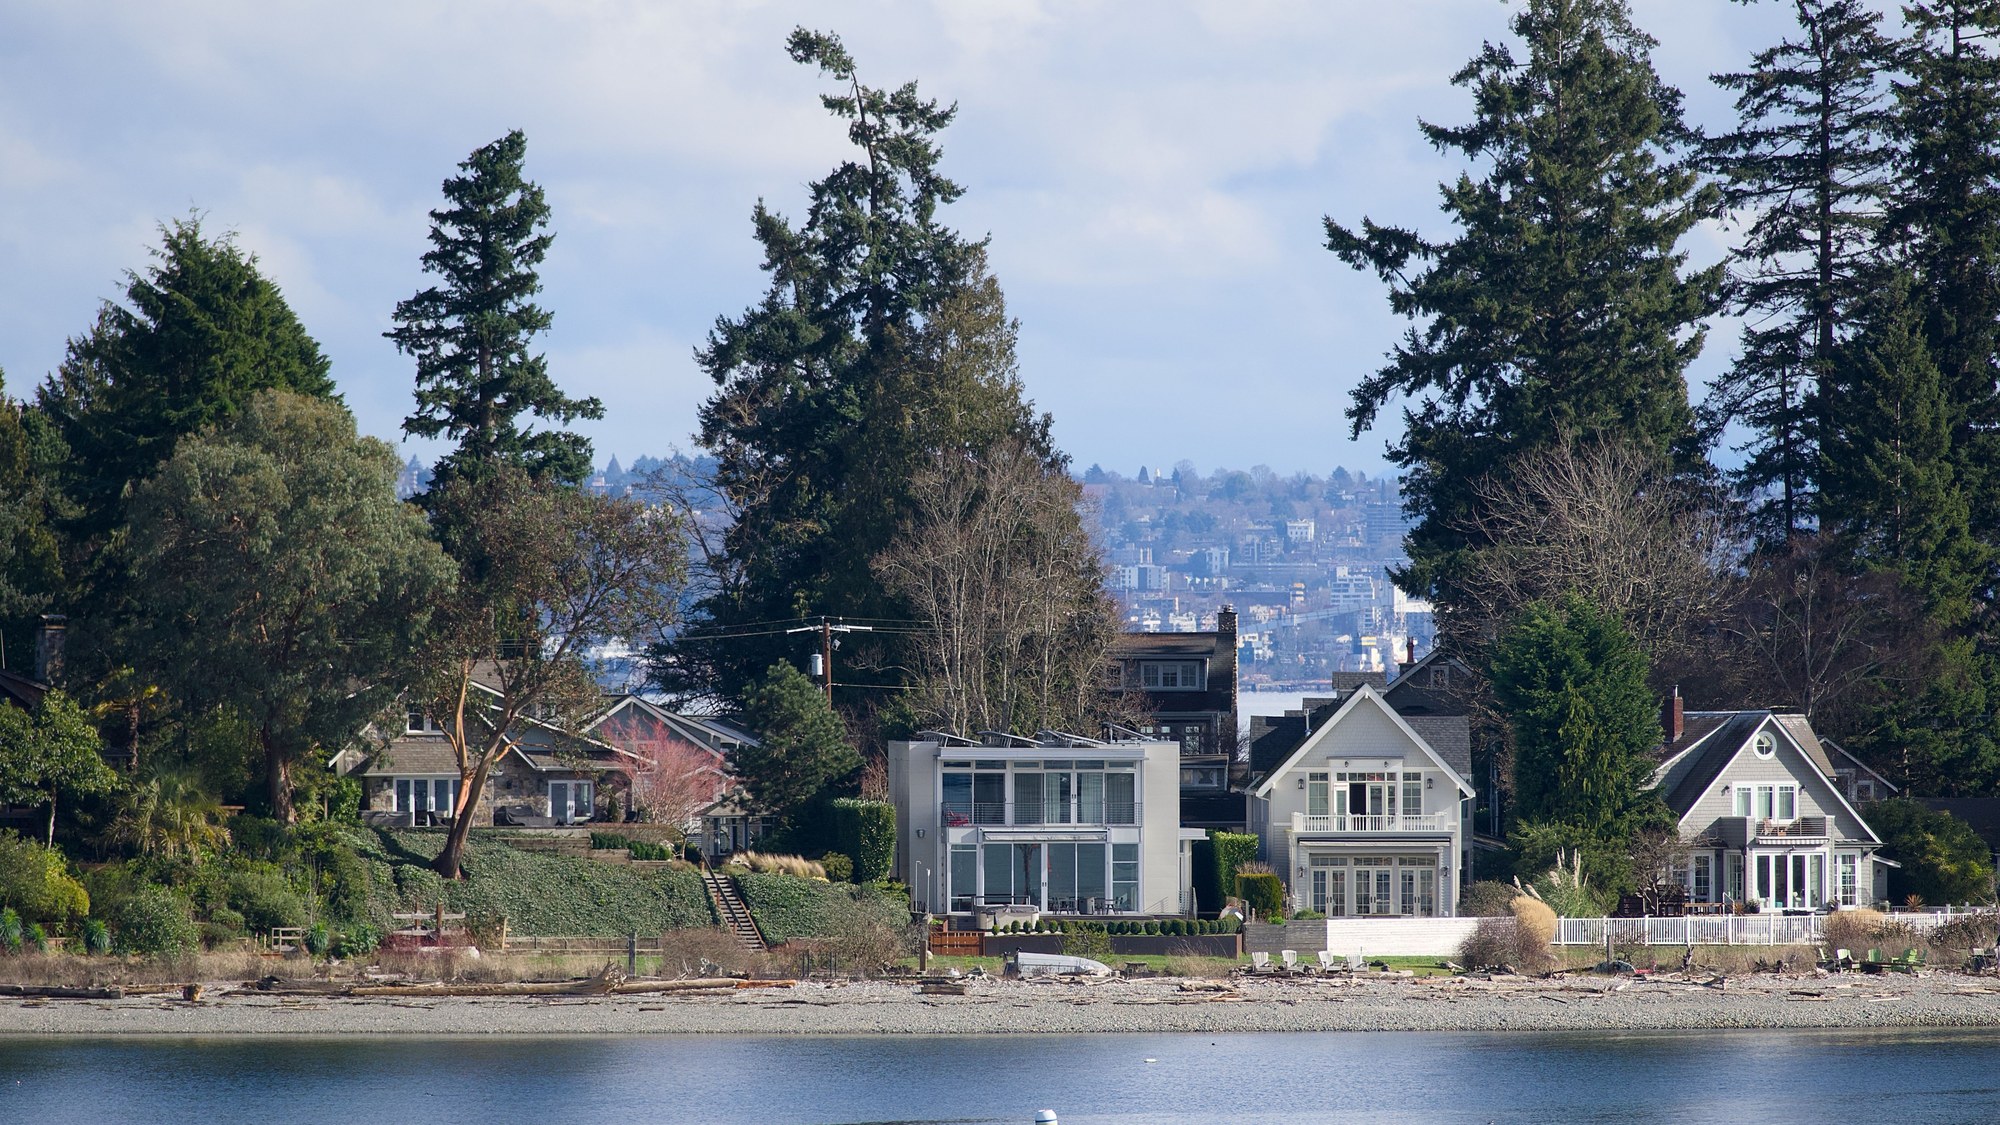
American homeowners will pay an average of $3,057 for property insurance this year, capping a 12% national price surge in 2025 that hit hardest in Georgia, New Mexico, Nebraska, and California, where double-digit increases are projected to continue into 2026. The acceleration is not uniform: those four states face steeper hikes than the rest of the country, driven by wildfire exposure, severe convective storms, and insurer retreat from high-risk markets. Federal data covering more than 246 million policies confirms that the ZIP codes most exposed to climate disasters already carry higher premiums and higher rates of policy nonrenewal, raising the prospect that rising costs will force some owners to sell before broader displacement trends show up in census data.
Four states absorbing the steepest premium increases
After a year in which the national average home insurance price jumped 12%, the insurance comparison platform Insurify projects a further 4% climb by the end of 2026. That national figure masks sharper pain in California, Nebraska, New Mexico, and Georgia, the four states Insurify identifies as facing double-digit percentage increases in 2026. In California, the January wildfires in Los Angeles County added fresh catastrophe losses on top of years of insurer pullbacks. Nebraska and Georgia face recurring severe storm seasons that have pushed claims costs well above historical norms. New Mexico’s wildfire and drought exposure rounds out the list.
For a homeowner in one of those four states, the practical math is blunt: a 10% or greater annual increase on a $3,000 policy adds at least $300 a year, compounding on top of the 12% jump already absorbed in 2025. Over two years, that trajectory can push monthly housing costs high enough to change affordability calculations, especially for owners on fixed incomes or adjustable-rate mortgages where escrow payments adjust annually.
Insurify’s projections also suggest that even states outside the top-risk group are unlikely to see relief. While the average national increase is smaller than the 2025 spike, it still represents another year in which insurance costs outpace wage growth in many regions. For buyers stretching to qualify for a mortgage, lenders’ escrow estimates may lag behind actual premium renewals, creating payment shocks when policies reset at higher prices.
Federal data links climate risk to coverage loss
A separate federal analysis reinforces the pattern. The U.S. Department of the Treasury, through its Federal Insurance Office, released a report drawing on a first-of-its-kind data effort with the National Association of Insurance Commissioners. That dataset covers more than 246 million homeowners policies from 2018 to 2022 and sorts ZIP codes into climate-risk quintiles. The findings are direct: average premiums are higher in the highest climate-risk quintile, and nonrenewal rates are also elevated in those same areas.
Nonrenewal is the quieter threat. When an insurer declines to renew a policy, the homeowner must find replacement coverage, often at a much higher price or through a state-backed insurer of last resort. In states like California and Louisiana, those residual markets have swelled in recent years. The Treasury report frames the trend as climate-related events driving both cost increases and availability declines, a combination that squeezes owners from two directions at once.
Higher nonrenewal rates also undermine local housing stability. Owners who cannot secure affordable coverage may fall out of compliance with mortgage requirements, since most lenders mandate continuous insurance. Even for households that manage to stay insured, the need to accept higher deductibles or narrower coverage can leave them more exposed when disasters strike, potentially turning an insurable loss into a financial shock that accelerates decisions to move.
Whether rising premiums trigger forced sales
The open question is whether sustained double-digit premium growth in high-risk areas will produce a measurable wave of forced home sales or voluntary departures. County deed records and MLS listing data can reveal distress signals-shorter ownership tenures, rising investor purchases, and discounts on homes in fire- or flood-prone neighborhoods-but those indicators typically lag behind the first years of premium escalation.
Economists tracking climate risk and housing markets note that the impact is likely to be uneven. Wealthier owners may absorb higher premiums as a cost of remaining in desirable coastal or wildland-adjacent locations. Lower- and middle-income households, by contrast, have less flexibility to offset rising insurance with budget cuts elsewhere. For retirees on fixed incomes, a few consecutive years of 10% premium increases can erode the cushion that made aging in place feasible.
Some homeowners respond by underinsuring-reducing coverage limits or dropping optional protections-to keep premiums manageable. Over time, however, this strategy can backfire, especially as rebuilding costs rise with inflation and stricter building codes. Others may opt to sell preemptively, fearing that further premium hikes or shrinking insurer options will trap them in an illiquid asset.
For now, researchers caution that a clear, nationwide pattern of climate-driven displacement has yet to appear in broad census data. Instead, the emerging picture is localized: particular ZIP codes where insurance strain is already visible in higher listing volumes, longer days on market, or modest price discounts relative to nearby, lower-risk neighborhoods. Industry analysts and public agencies are watching these early signals closely, using tools such as insurance market datasets and granular policy records to monitor when affordability stress begins to translate into actual moves.
How policymakers respond will help determine whether rising premiums remain a painful line item or evolve into a driver of migration. Expanded mitigation funding, incentives for resilient construction, and reforms to state residual markets could slow the pace of premium growth in the riskiest areas. Absent those interventions, the combination of higher prices and shrinking coverage options may gradually redraw the country’s housing map, one renewal notice at a time.
Free tool for readers: Most people don’t find out they’re off track until it’s too late. You can see where your retirement stands with a free Retirement Safety Score in about five minutes — no sign-up required to see it.