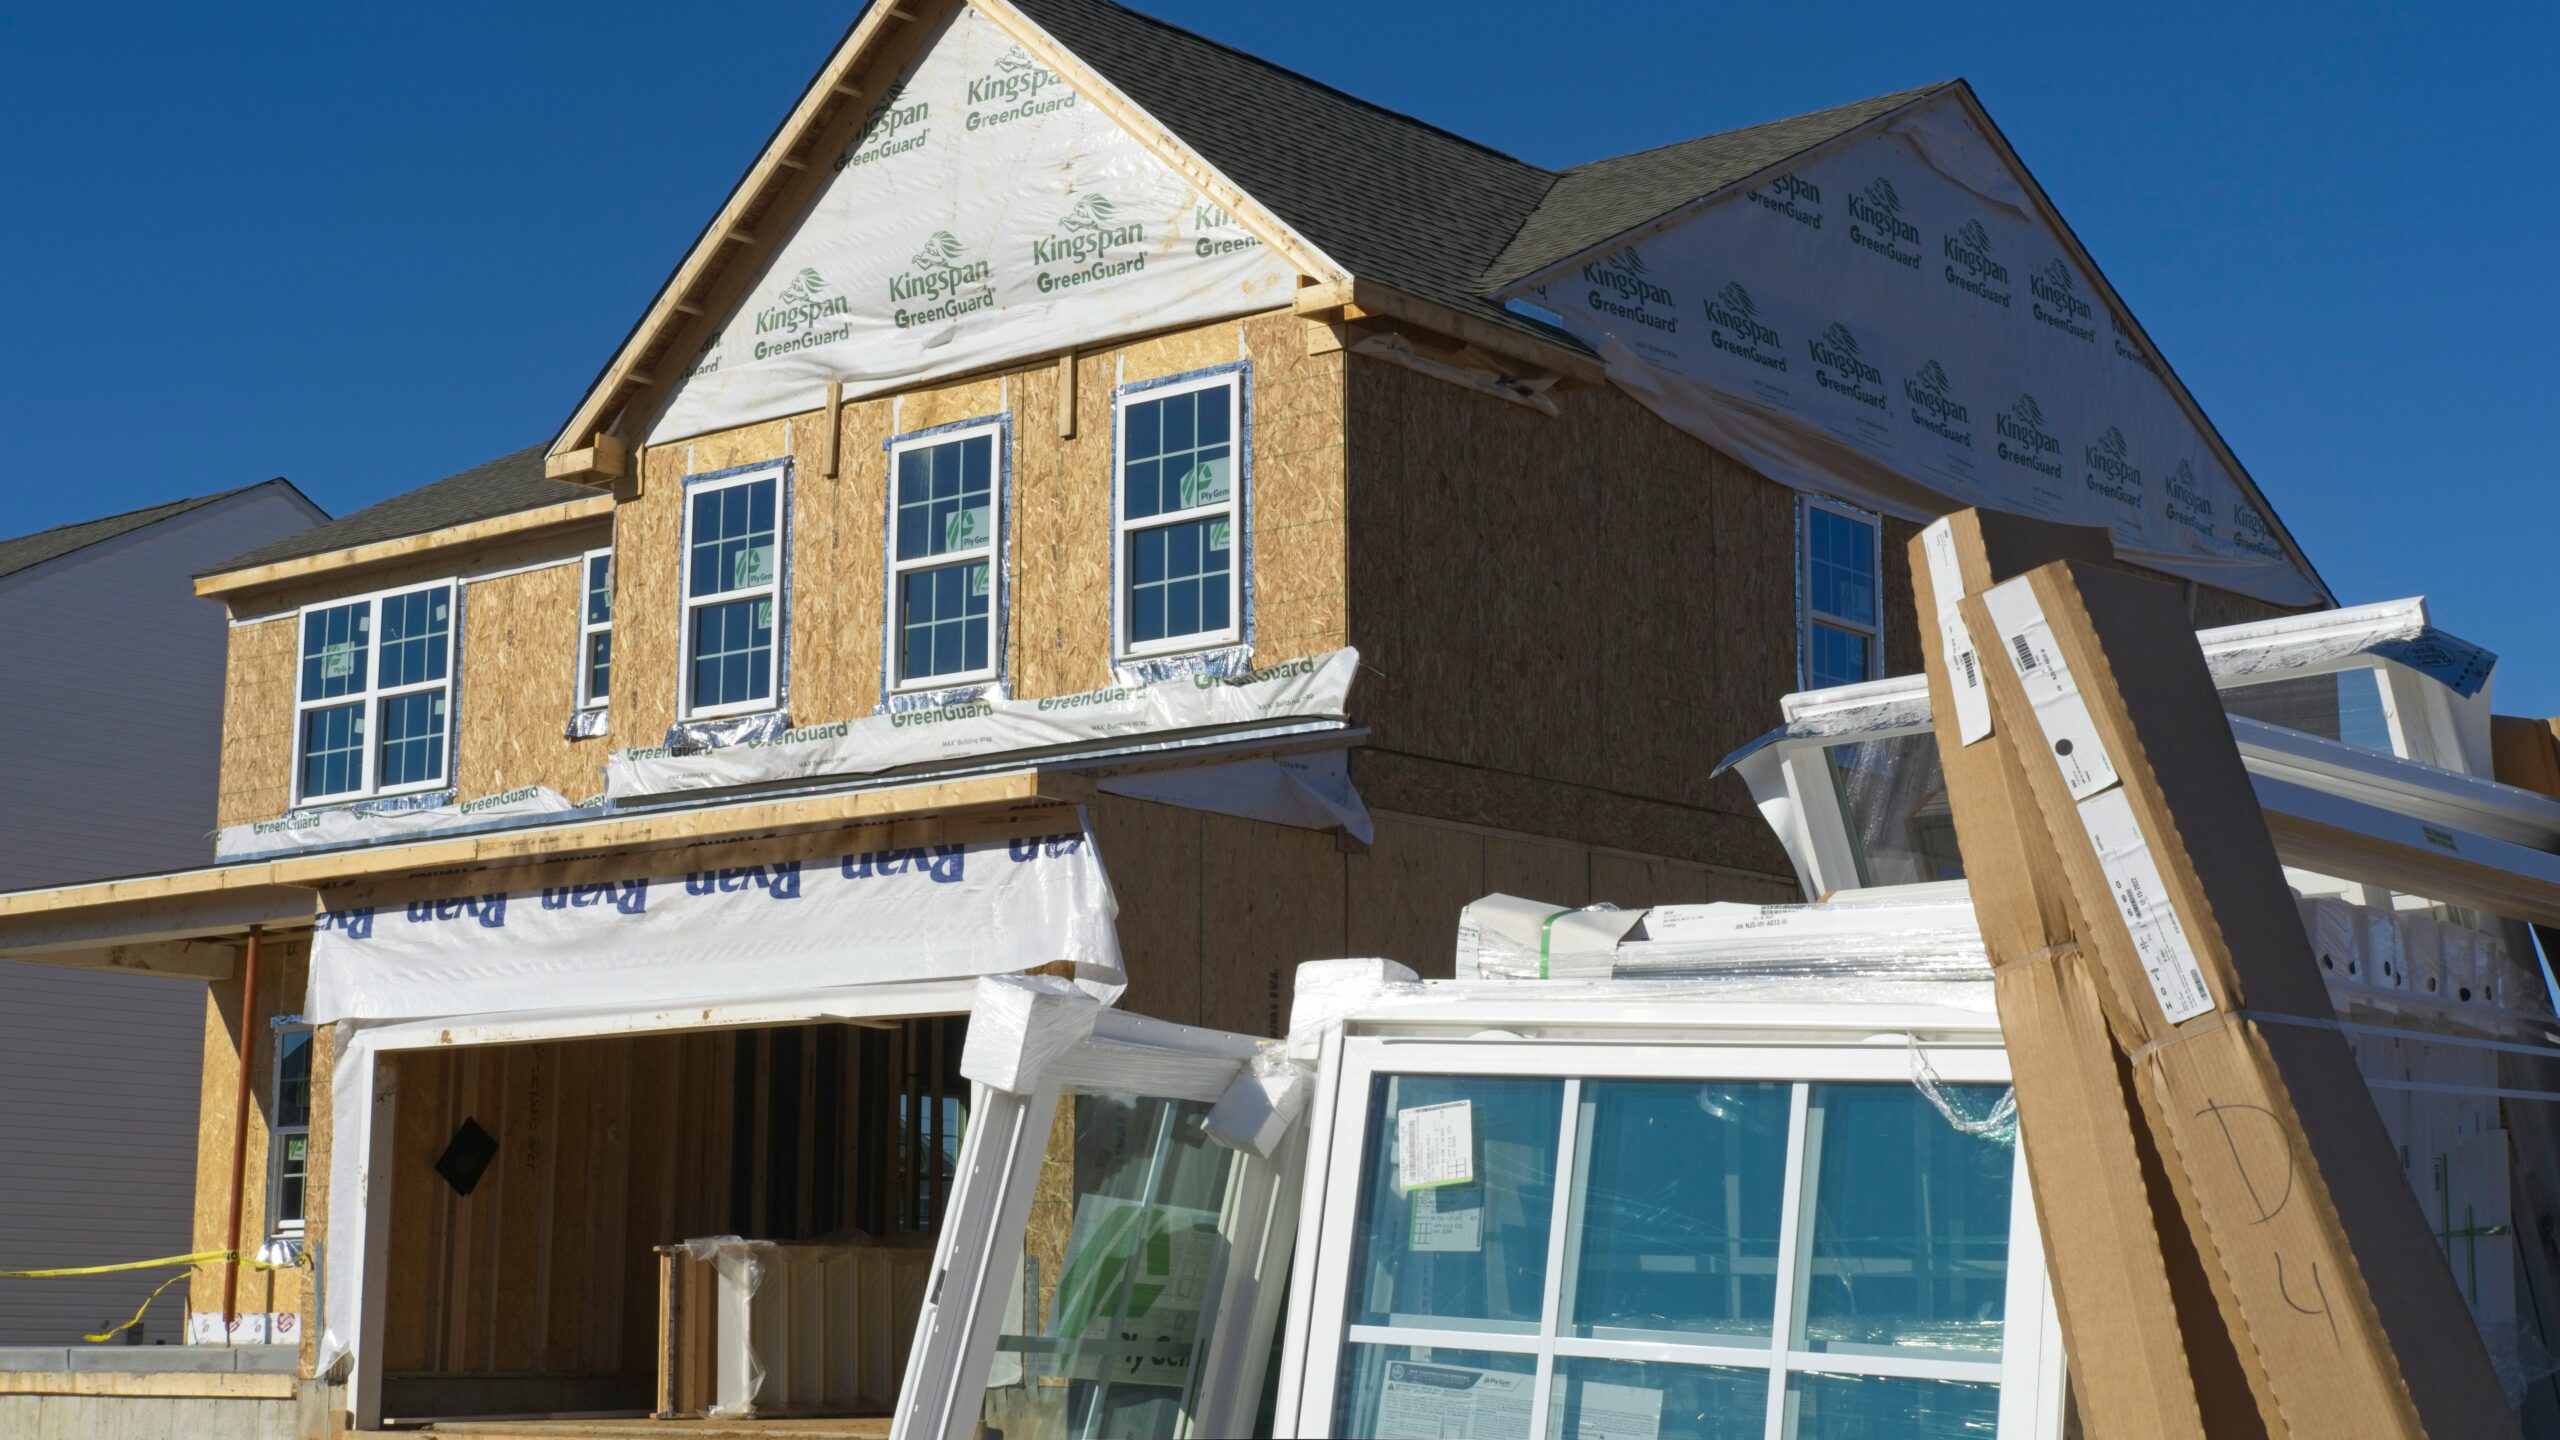
Across Sun Belt subdivisions from suburban Dallas to the outskirts of Orlando, finished homes are sitting on lots with no buyers in sight. The April New Residential Sales report, published jointly by the U.S. Census Bureau and the Department of Housing and Urban Development, put the damage in numbers: new home sales fell to a seasonally adjusted annual rate of 622,000, a pace not seen since late 2022 based on the published data series. The supply of unsold new homes climbed to 9.4 months, far above the six-month level economists consider balanced. For buyers who spent the past several years losing bidding wars and waiving inspections, the power dynamic in the new-construction market has flipped.
Builders saw this coming. The National Association of Home Builders/Wells Fargo Housing Market Index for May 2026 showed that 32 percent of builders cut prices during the month, extending a pattern that has held since late 2024. Price reductions alone have not been enough to move inventory, so many builders are also stacking mortgage-rate buydowns, closing-cost credits worth $10,000 to $20,000, and free design upgrades on top of lower sticker prices.
Why sales stalled in April
Mortgage rates remain the single biggest drag. The 30-year fixed rate hovered near 6.8 percent through most of April, according to Freddie Mac’s Primary Mortgage Market Survey, keeping monthly payments painfully high even where builders have trimmed asking prices. Consider the math: a buyer purchasing at the national median new-home sale price of $407,200, the figure reported in the April Census release, faces a principal-and-interest payment of roughly $2,130 a month at 6.8 percent with 20 percent down. That number alone has sidelined a large share of first-time buyers and pushed move-up buyers to wait for relief.
Supply has compounded the problem. Permits and housing starts pulled forward during 2024’s brief window of rate-dip optimism have now translated into completed spec homes sitting vacant. The Census data shows that finished but unsold homes make up a growing slice of the 9.4-month inventory total. Buyers in many markets can now tour move-in-ready properties and negotiate from a position of strength rather than signing a contract and waiting months for construction.
The South and West are absorbing the worst of it
The regional breakdown in the Census release tells a lopsided story. The South, which accounts for the largest share of new construction nationally, absorbed the steepest sales decline. Fast-growing metros across Texas, Florida, and the Carolinas, where builders ramped up aggressively during the pandemic housing boom, now face the most acute oversupply. The West also posted notable weakness. By contrast, the smaller Northeast and Midwest markets held up better, largely because builders never added as much speculative inventory in those regions to begin with.
Large publicly traded builders, including D.R. Horton, Lennar, and PulteGroup, have acknowledged the inventory overhang in recent quarterly earnings calls, noting that incentive spending has risen as a share of revenue. Smaller regional builders face even sharper pressure. Without the balance-sheet depth to carry months of unsold homes, some have begun pausing new lot acquisitions or delaying spec-home starts until existing stock clears.
What 9.4 months of supply means at the negotiating table
A 9.4-month supply hands buyers a degree of leverage that would have been unthinkable in 2023 or early 2024. In oversupplied Sun Belt markets, multiple competing communities are now chasing the same limited pool of qualified buyers. That competition is showing up as rate buydowns that shave half a percentage point or more off a buyer’s effective mortgage rate, closing-cost contributions that can reach five figures, and design-center credits for upgrades like quartz countertops or premium flooring.
That leverage is not uniform, though. Builders in supply-constrained pockets of the Northeast or infill locations along coastal California are not sitting on the same glut, and their concession packages tend to be far thinner. The national 9.4-month figure is an average that masks wide local variation, so buyers need to study their specific metro’s inventory conditions before assuming they hold all the cards.
How reliable are these numbers?
New home sales data carries wide confidence intervals, and the Census Bureau’s own technical notes stress that these are sample-based estimates, not a full count of every transaction. Month-to-month swings can look more dramatic than the underlying trend warrants. The March 2026 sales figure, for instance, was revised in the April release, slightly shifting the baseline. Analysts typically smooth the noise by focusing on three-month moving averages and year-over-year comparisons rather than reacting to a single print.
The 32 percent price-cutting figure from the NAHB survey also warrants a caveat. It reflects self-reported behavior from a sample of builders, not actual closed-transaction prices recorded in government data. A builder who trims a base price by $1,000 and one who slashes it by $30,000 both register the same way in the headline percentage. The depth and structure of discounts vary enormously by market and price tier.
Three signals that will shape new-home pricing through summer 2026
May 2026 inventory data has not yet been released, so whether the 9.4-month supply figure continued to climb or whether late-spring foot traffic helped absorb some backlog remains an open question. Three upcoming data points will clarify the trajectory.
First, the next New Residential Sales report will reveal whether May brought any rebound in contract signings or whether the April slump deepened. Second, Freddie Mac’s weekly rate surveys will signal whether mortgage costs are drifting lower, a shift that could pull sidelined buyers back into the market and help builders clear standing inventory. Third, the NAHB’s June 2026 sentiment reading will show whether the share of builders cutting prices is still climbing or has finally plateaued.
Right now, the data tells a straightforward story: builders have more homes than they can sell at current prices and rates, and they are responding with concessions that were rare just 18 months ago. Buyers who compare incentive packages across competing communities and use the inventory overhang as a negotiating tool are walking into the strongest new-home market conditions since the post-pandemic cooldown began.