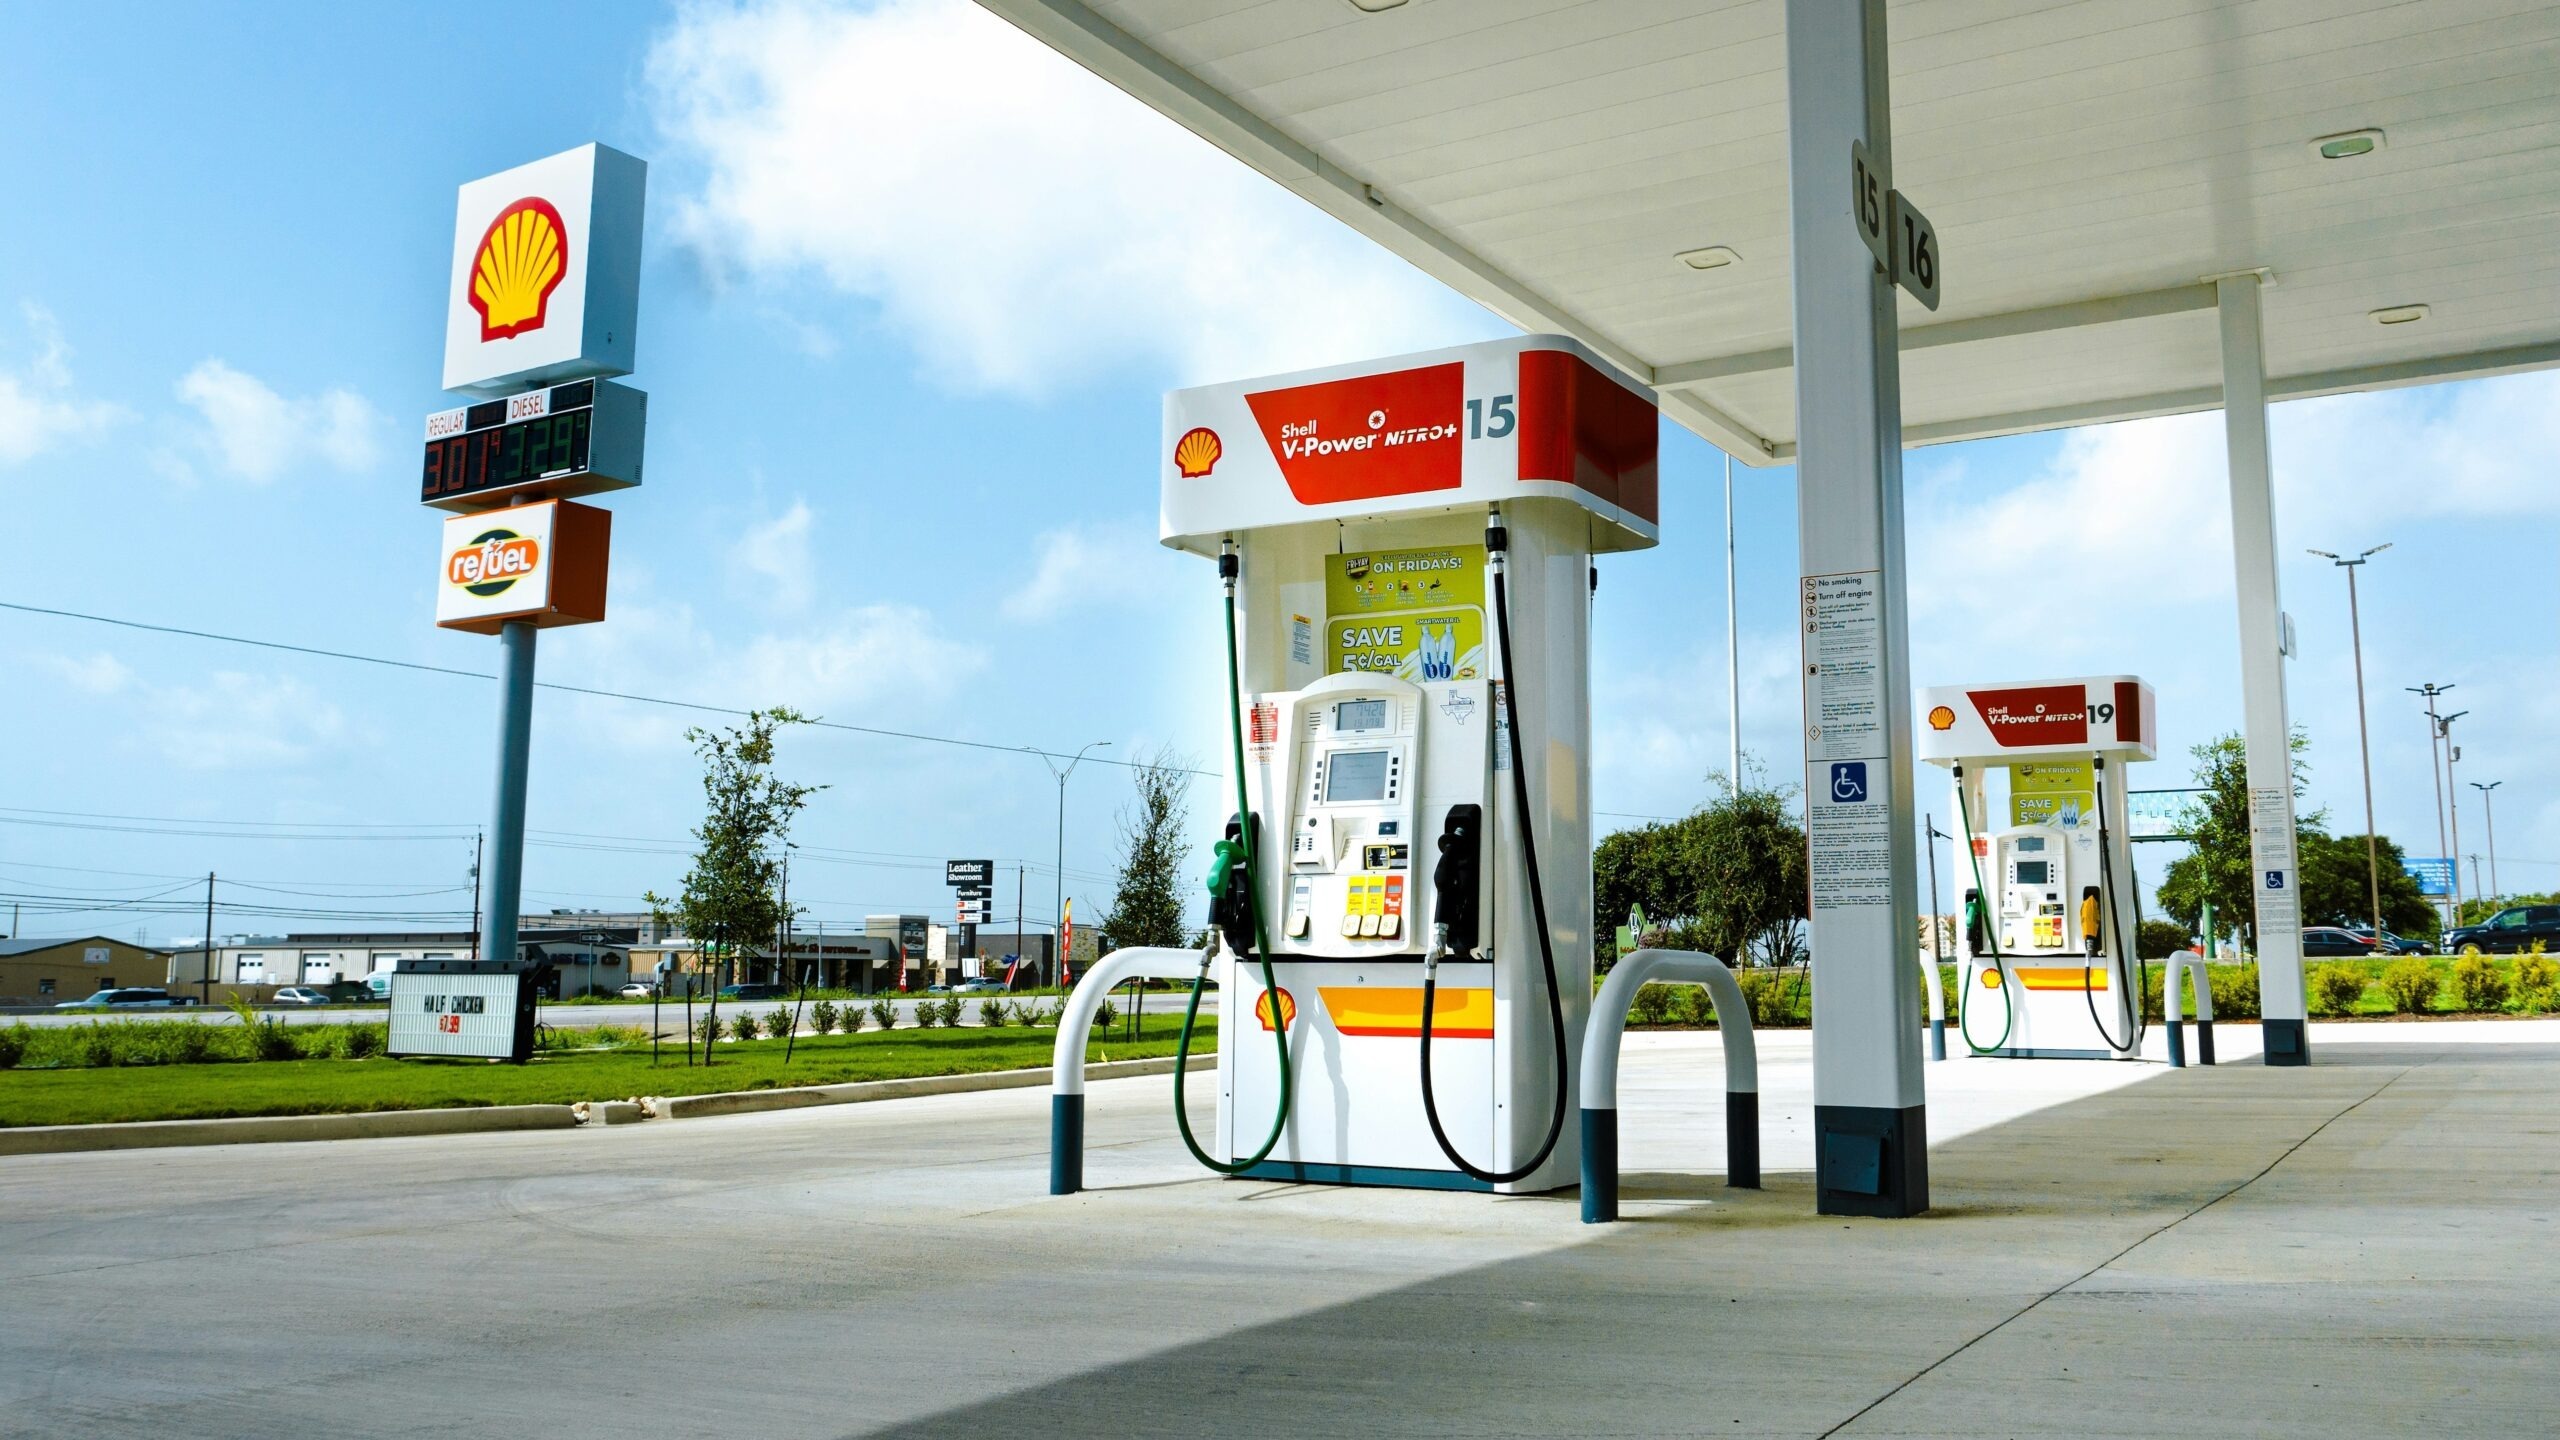
American drivers are paying $3.99 a gallon for regular gasoline at the national level, a sharp retreat from the $4.56 peak recorded in late May 2026. The drop of roughly 57 cents per gallon arrived faster than many analysts expected, raising questions about whether falling crude prices or swelling regional fuel inventories deserve more credit for the relief showing up at the pump.
How the $3.99 average reshapes summer driving costs
The speed of this decline carries real consequences for household budgets during peak travel season. A driver filling a 12-gallon tank now spends about $6.84 less per fill-up than at the late-May high. Spread across two fill-ups a week for a family with multiple vehicles, that gap adds up to more than $50 a month in recovered spending power. The move below $4 also eases pressure on small businesses that rely on delivery fleets, where fuel is often the single largest variable cost after labor.
The retreat from $4.56 did not happen evenly. The EIA fuel update, which publishes weekly retail prices including taxes at the national, regional, state, and selected-city level, shows the steepest week-over-week drops concentrated in the Midwest and Gulf Coast PADD regions. Those areas share a common trait: they sit closest to refinery clusters and pipeline hubs where inventory builds tend to register first. West Coast prices, by contrast, have been slower to fall, a pattern consistent with tighter local supply and higher state fuel taxes rather than any national crude-price signal.
That geographic split supports a specific reading of the data. If crude-oil spot prices were the dominant driver, the decline would look more uniform across regions. Instead, the lopsided geography points toward regional inventory builds as the stronger short-term force pulling the national average down.
EIA data and the inventory signal behind falling prices
The primary evidence sits in two government datasets. The EIA’s weekly retail-price series confirms that U.S. regular gasoline reached $4.56 during the May–June 2026 window and then moved below $4. That same series allows week-by-week comparison across PADD districts, making it possible to track where declines appeared earliest and by how much.
Inventory data published alongside the weekly fuel update tell a complementary story. Gasoline stocks in PADD 2 (Midwest) and PADD 3 (Gulf Coast) built faster than seasonal norms through early June, according to the EIA’s weekly supply reports. When regional inventories climb above the five-year seasonal band, wholesale rack prices typically soften within days, and retail prices follow with a short lag. That sequence matches the timeline visible in the current data: wholesale prices in the Midwest began falling roughly a week before the national retail average crossed below $4.
Crude oil, meanwhile, did decline over the same stretch, but the magnitude was modest relative to the gasoline-price swing. A barrel of West Texas Intermediate lost a smaller percentage than the per-gallon retail price did, suggesting that refining margins and local supply conditions amplified the move at the pump beyond what crude alone would explain. Refiners in the Gulf Coast, operating close to major export terminals and domestic pipelines, appear to have used the cushion of rising inventories to trim wholesale offers more aggressively than counterparts in tighter markets like California.
Why natural gas and refining economics matter
Another piece of the puzzle sits upstream of the refinery gate. Many U.S. refineries and petrochemical complexes rely on natural gas both as a fuel and as a feedstock for hydrogen production, which is essential for upgrading crude into finished products like gasoline and diesel. When natural gas prices are stable or easing, operating costs for those plants fall at the margin, making it easier for refiners to accept lower gasoline prices without eroding profitability as quickly.
Recent data from the EIA’s natural gas storage reports show inventories running comfortably within or above typical seasonal ranges. Ample gas in storage tends to cap wholesale gas prices, which in turn keeps a lid on refinery fuel and power costs. While this effect is secondary compared with the direct influence of gasoline inventories, it reinforces the broader theme: abundant energy supplies across multiple fuels are working together to relieve pressure on consumers.
Refining margins-the difference between the value of refined products and the cost of crude-also help explain why gasoline prices can fall faster than oil. When inventories swell, especially in key hubs like the Gulf Coast, product prices often drop more sharply than crude benchmarks as refiners compete to move barrels. That compression in margins is visible in the recent data and lines up with the outsized retail decline relative to the modest slide in oil.
What drivers should watch next
For motorists, the immediate question is whether sub-$4 gasoline will last through the heart of the summer driving season. The answer hinges on the same indicators that drove the recent decline: regional gasoline stocks, refinery utilization rates, and the trajectory of crude prices. If inventories in the Midwest and Gulf Coast remain above seasonal norms and refineries avoid major unplanned outages, the national average has room to stay near or below current levels, even if oil prices firm modestly.
On the other hand, a hurricane disrupting Gulf Coast refining, a sharp rebound in global crude benchmarks, or a sudden drawdown in gasoline stocks could all reverse part of the recent relief. For now, though, the data suggest that regional inventory builds-more than any single move in crude-have delivered a rare mid-season break for American drivers, reshaping fuel budgets just as summer travel hits its stride.