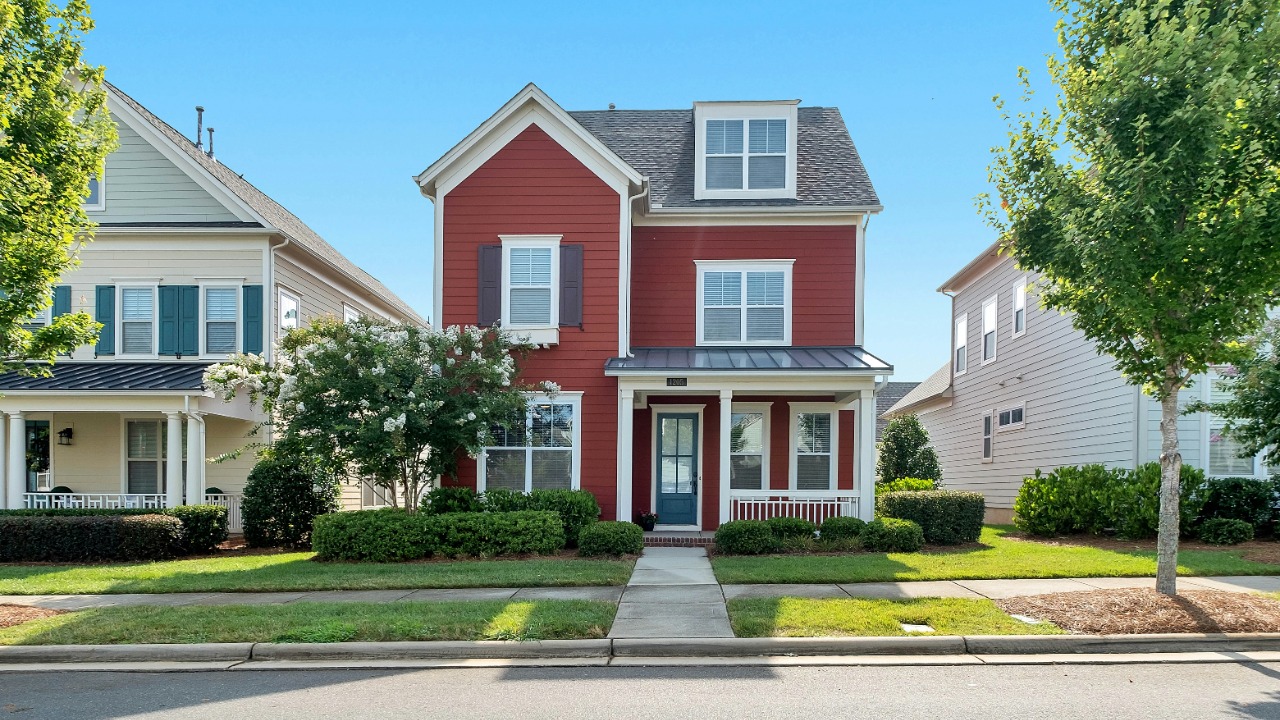
The federal agency that tracks home values nationwide says prices kept climbing through the spring, though not everywhere and not evenly. A homeowner’s equity, and the property-tax bill that often follows it upward, moved in sharply different directions depending on which state that home sits in. The figures come from the government’s own index of repeat home sales and mortgage refinances, built from records collected across every state rather than a private real-estate listing service, and they arrive on a quarterly lag that puts the second quarter’s snapshot in the public record only now, at the end of summer, roughly eight weeks after the quarter itself closed.
FHFA’s House Price Index for the Second Quarter
The Federal Housing Finance Agency’s House Price Index release, published Aug. 25, 2026, reports that U.S. house prices rose 2.1% between the second quarter of 2025 and the second quarter of 2026. On a quarterly basis, prices rose 0.3% from the first quarter of 2026 to the second, a pace slower than the year-over-year average would suggest if repeated evenly across all four quarters. The agency’s seasonally adjusted monthly index for June 2026 came in flat, unchanged from May, suggesting the second quarter’s gain was concentrated earlier in the spring rather than building through June. FHFA’s index is based on repeat transactions and appraisal data tied to mortgages that Fannie Mae and Freddie Mac have purchased or securitized, which anchors the figures in actual closed sales rather than listing or asking prices.
FHFA describes its flagship index as built on a “weighted, repeat-sales statistical technique” applied to seasonally adjusted, purchase-only data drawn from loans the two mortgage giants have bought, which is why the index tracks the same homes over time as they resell rather than comparing different homes to one another the way a median-price listing figure would. FHFA separately publishes versions of the index that add in refinance transactions, FHA-insured loans and real property records, though the 2.1% headline figure in this release comes from the core purchase-only measure.
Inside the kit: The circuit-breaker credit that includes renters and the worksheets for comparing relief programs in The Senior Property Tax & Home-Cost Relief Kit give a homeowner a way to check what’s available before an assessment catches up with a rising home value.
Alaska’s Lead and New Mexico’s Decline
State-level results in the same release show a wide spread. Alaska recorded the largest year-over-year gain in the country at 8.3%, followed by Vermont at 7.3% and Hawaii at 5.8%. New Mexico was the outlier in the other direction, posting the country’s largest decline at 1.2% over the same twelve months. FHFA’s release does not explain the state-by-state divergence, but the gap between Alaska’s 8.3% gain and New Mexico’s 1.2% decline is close to ten percentage points within a single national index that averaged 2.1% overall. A homeowner in Alaska whose local assessor updates property values off this same data is looking at a far larger jump in assessed value than a homeowner in New Mexico, even though both states are folded into the same 2.1% national headline.
46 States and the District of Columbia
FHFA reports price increases in 46 states plus the District of Columbia over the year, meaning four states, including New Mexico, recorded outright declines rather than merely slower growth. The report’s national 2.1% figure and 0.3% quarterly figure are both averages across that uneven state-by-state picture, which means a homeowner’s actual experience depends heavily on which side of that 46-state, four-state split their property falls on. The same release breaks the country into nine census divisions, all nine of which posted a positive annual change; the East North Central division led at 4.5%, while the Pacific division was the slowest, just above 0%. FHFA publishes the index quarterly and separately each month, and its next monthly report is scheduled for Sept. 29, 2026, with the next quarterly release due Nov. 24, 2026.
A Fourteen-Year Streak of Annual Gains
FHFA’s release places the second quarter inside a much longer run: the agency states that “the U.S. housing market has experienced positive annual appreciation each quarter” going back to early 2012 — a streak now running roughly fourteen years without a single year-over-year quarterly decline in the national index. That streak has continued even as the pace of appreciation has slowed from the sharper gains of recent years to the 2.1% recorded for the year ending in the second quarter of 2026 — still positive, in FHFA’s own framing, but a smaller annual increase than the index has shown in several of the years since 2012. At the metro level, FHFA’s release says 76 of the 100 largest metro areas saw prices rise over the same four quarters, led by Elgin, Illinois, at 7.7% annual appreciation, while Everett, Washington, posted the weakest reading among large metros at a 3.7% annual decline — a spread that echoes the gap between Alaska and New Mexico at the state level. FHFA maintains an interactive dashboard on its website listing all 100 of those large-metro rankings, updated on the same quarterly schedule as the state and national figures published in this release.
An Assessment Notice FHFA’s Index Doesn’t Predict
FHFA’s 2.1% national figure and the state-by-state spread behind it say nothing about when a local assessor will update the value on a specific home, or what that update will do to next year’s property-tax bill. Freezes, exemptions and circuit-breaker credits exist to soften that gap in most states, but none of them apply automatically once an assessment rises.
The Senior Property Tax & Home-Cost Relief Kit lays out the five kinds of property-tax relief and pairs them with an application log and renewal calendar for tracking what’s been filed where.
See the five relief types in The Senior Property Tax & Home-Cost Relief Kit.
This article was produced with AI assistance and checked against the primary source linked above.