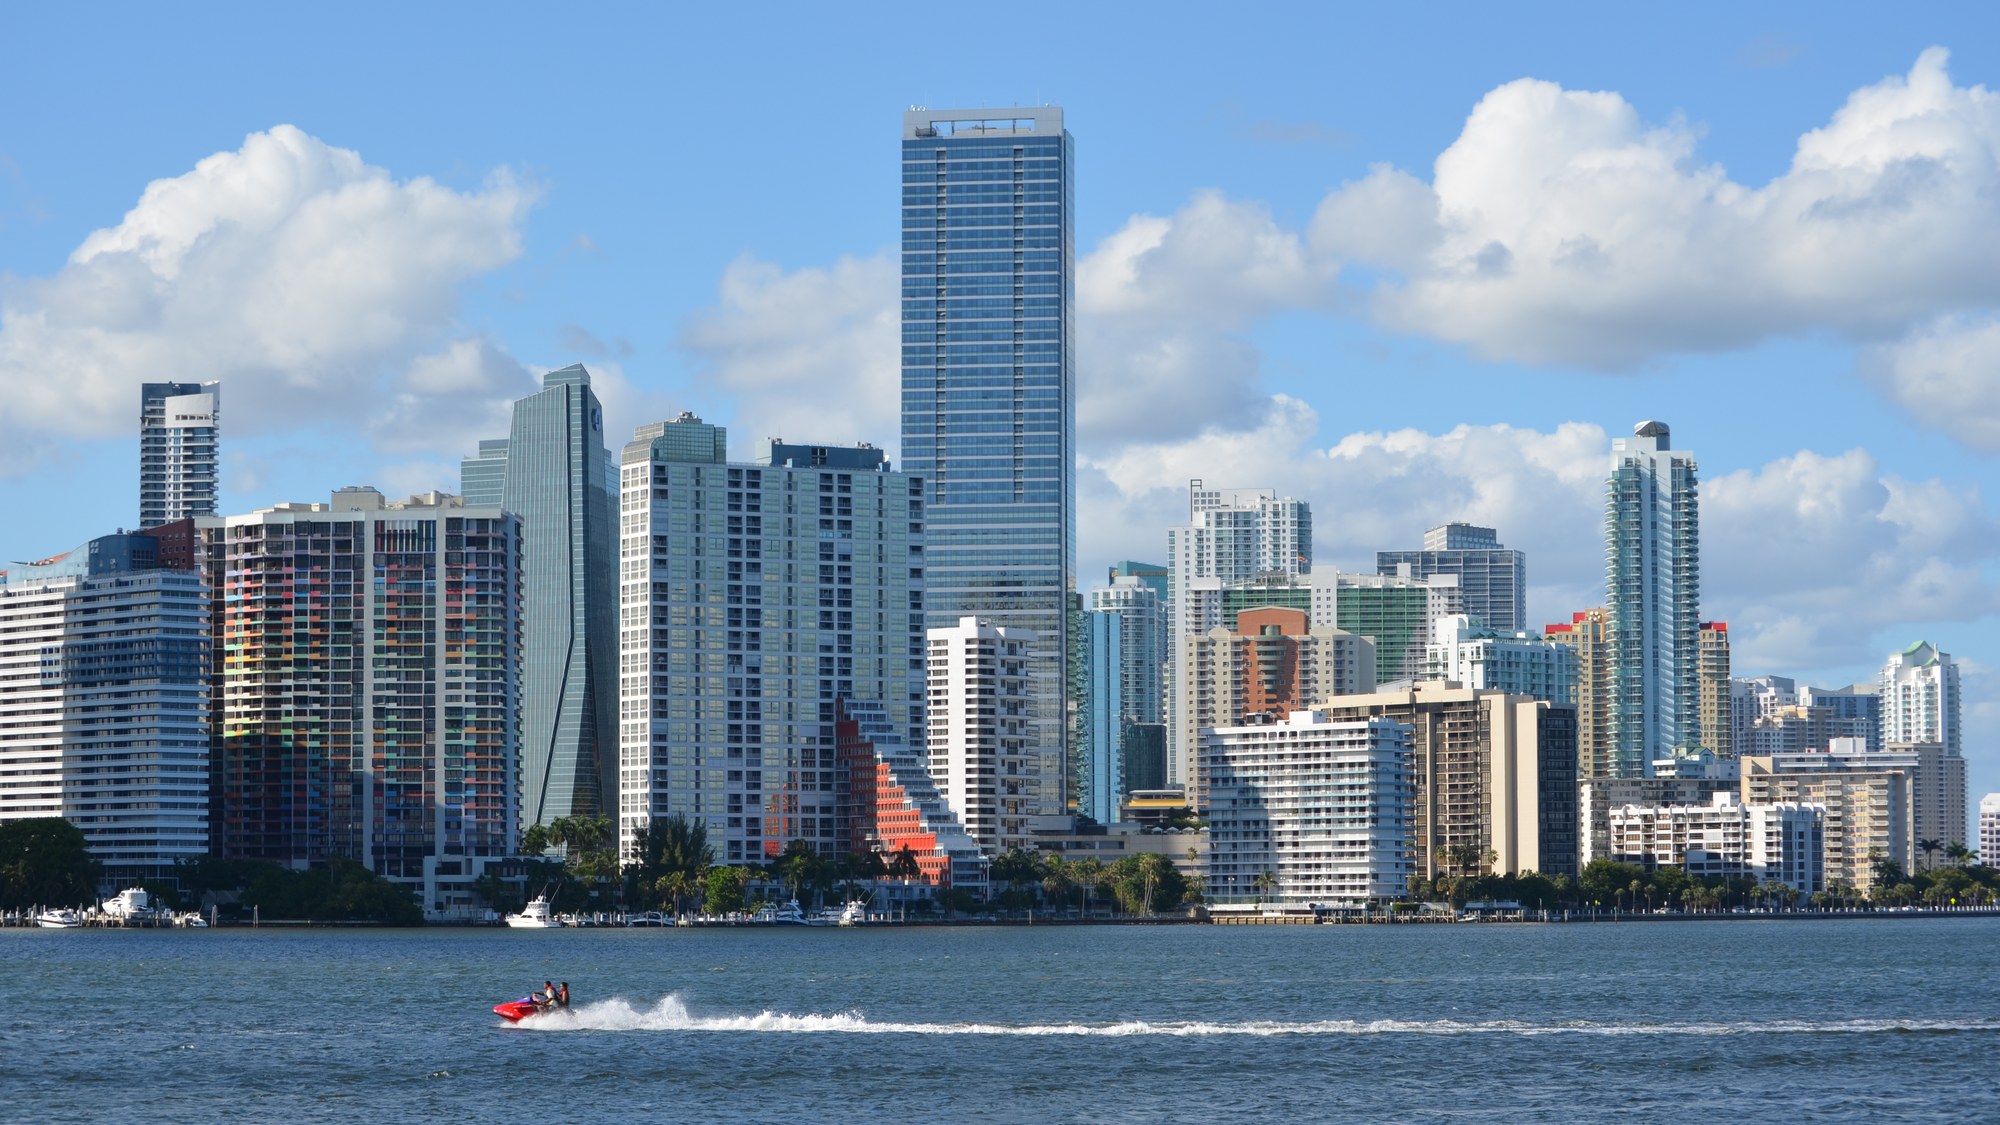
Redfin estimated that August left Miami with 138.3% more home sellers than buyers and Houston with 130.9%, the second- and third-widest gaps among the metros the brokerage ranked. Nationally, Redfin counted 1,534,918 sellers against 972,300 buyers, a gap of 57.9% that widened from 52.1% in July. Both Sun Belt metros sit on the brokerage’s list of top buyer’s markets, a shift that matters to older owners whose home equity often carries much of their retirement finances.
How Redfin turns listings into a seller surplus
Redfin’s yardstick is deliberately simple. The brokerage states that the “estimated number of sellers in the market is simply the number of active listings in the MLS,” and it sets that count against its estimate of buyers to produce a percentage gap. In August the seller estimate rose 3.9% from July while the buyer estimate rose 0.1%, according to Redfin’s August buyers-versus-sellers report by Dana Anderson and Asad Khan, published Sept. 10 and updated Sept. 25.
A 138.3% gap means active listings in Miami equal roughly 2.4 times Redfin’s buyer estimate; Houston’s 130.9% works out to about 2.3 times. The national figure of 57.9% is a ratio of about 1.6 sellers per buyer. Nashville topped the ranking at 139.3%, followed by Miami, Houston and Orlando at 121.5%, with Las Vegas at 117.1%, San Antonio at 116.3% and Austin at 115.0% completing the seven.
Only five areas nationally were seller’s markets, meaning buyers outnumbered sellers: Nassau County, N.Y. (a negative 27.6% gap), Newark, N.J. (negative 20.7%), Montgomery County, Pa. (negative 20.3%), Milwaukee (negative 17.7%) and San Francisco (negative 11.7%).
Five of the seven widest gaps sit in Florida and Texas
Miami and Orlando in Florida, along with Houston, San Antonio and Austin in Texas, account for five of the seven metros on Redfin’s list. The brokerage’s Asad Khan summed up the national picture this way: “With sellers piling into the market and demand falling flat, today’s house hunters can afford to be choosy.”
The measure counts listings and estimated buyers, not sale prices or the time a home spends on the market. The numbers therefore show how crowded the field is for shoppers in each metro, not what any individual house will fetch. Financing costs, which shape how many buyers can act, come from other sources.
Borrowing costs that keep the buyer count flat
Freddie Mac’s weekly survey put the 30-year fixed mortgage rate at 7.03% as of Sept. 24, up from 6.95% the previous week and 6.30% a year earlier. The 15-year rate stood at 6.42%, compared with 5.49% a year earlier, according to Freddie Mac’s Primary Mortgage Market Survey. Those readings line up with the flat buyer estimate in Redfin’s report: buyers rose 0.1% in August even as sellers rose 3.9%.
The pattern extends to the mortgage market’s other side. Redfin’s own numbers show more listings arriving, 3.9% more sellers in one month, while buyers barely moved, so the gap widened from the supply side as much as from weaker demand.
New-home builders add supply and sweeten deals
Resale listings are not the only inventory in these metros. The Census Bureau estimated that 483,000 new single-family houses were for sale at the end of August, a supply of 8.5 months at the current sales pace, with a median new-home sales price of $393,700, according to its August new residential sales report, released Sept. 24. The agency put that price 5.8% below August 2025, a change that falls within the survey’s margin of error of plus or minus 8.2%.
Builders are responding with price cuts and incentives. In the National Association of Home Builders’ September survey, 38% of builders reported cutting prices, up from 35% in August, with an average reduction of 6%, and 66% said they used sales incentives, up from 63%, according to the NAHB Housing Market Index. The survey’s overall index fell 3 points to 32. A seller listing an existing home in Miami or Houston competes for the same buyers those incentives are aimed at.
Home equity carries more of the retirement load for older owners
Older Americans own homes at high rates. The Census Bureau’s second-quarter housing vacancy survey, released July 28, put the overall homeownership rate at 65.0% and the rate for householders 65 and older at 78.6%, according to its quarterly homeownership and vacancy report. The same report put the homeowner vacancy rate at 1.2%, compared with 1.1% a year earlier. Because most older households own, a widening gap between sellers and buyers in large metros bears on a wide slice of retirees’ balance sheets.
Redfin’s August figures, the Census new-home data and the Freddie Mac rate all point in the same direction for now: more listings, cautious demand and borrowing costs above year-earlier levels. Redfin’s ranking placed Miami at 138.3% and Houston at 130.9%, both far above the national 57.9%.
Relief for owners who decide to stay put
For older owners who stay in their homes through a buyer’s market, property tax remains one of the few housing costs with relief programs attached. Those freezes, exemptions and credits are usually granted only on application and must be renewed.
The Senior Property Tax & Home-Cost Relief Kit describes the 5 kinds of property-tax relief and covers heating, cooling and home-repair help, along with an application log and renewal calendar.
See the five kinds of relief in The Senior Property Tax & Home-Cost Relief Kit.
This article was produced with AI assistance and checked against the primary sources linked above.