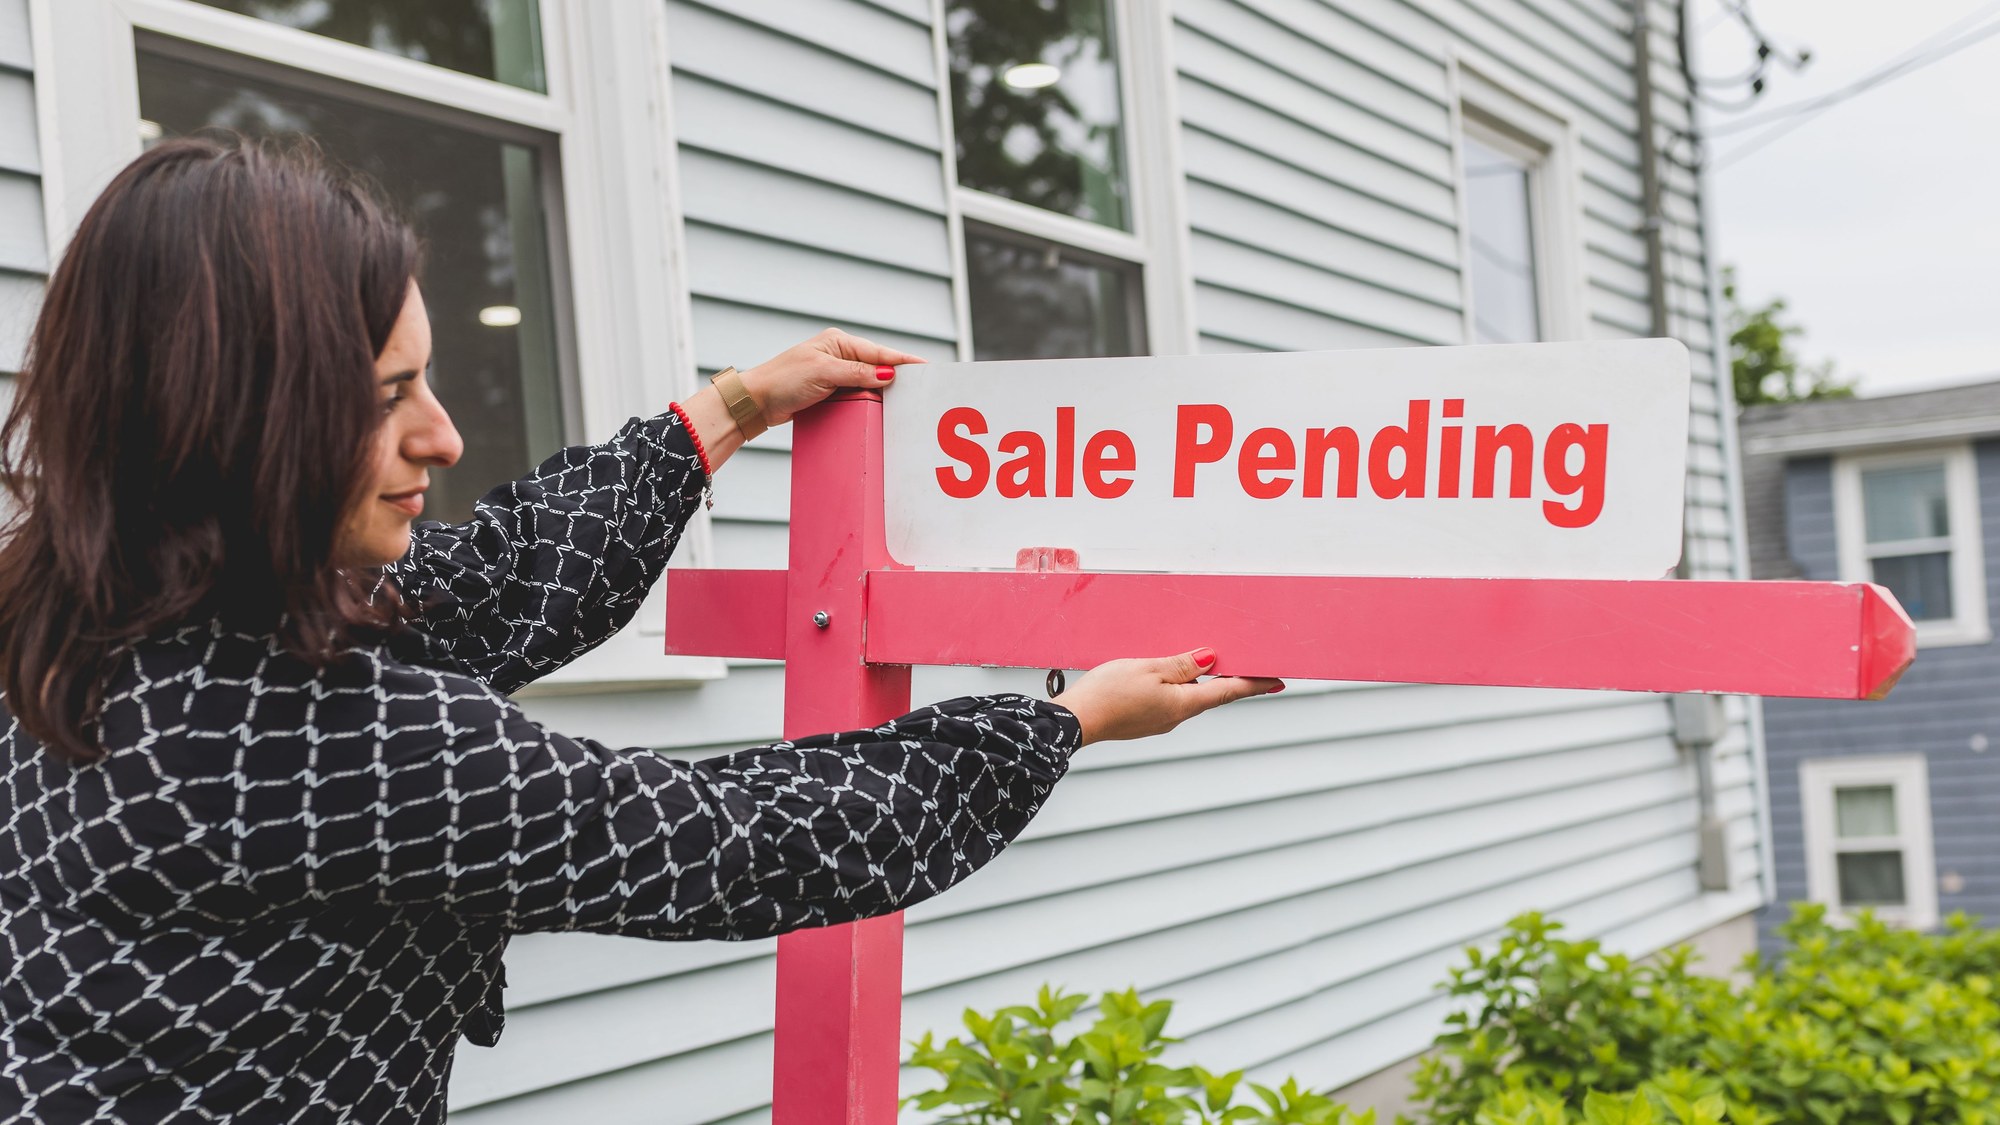
Zillow says newly pending listings fell 16.8% in October from a year earlier, the biggest annual drop since August 2023. The typical monthly mortgage payment on a typical U.S. home reached $2,004 with 20% down, up 12.8% in a year, the company’s October market report shows. Zillow’s chief economist expects the pullback in contracts to keep showing up in sales.
The question for anyone who owns a home, or is weighing a sale or a loan against one, is how much of October’s slump is a one-month jolt and how much is the new price of money. Zillow ties the slide to mortgage rates, which averaged 7.33% in October after 6.86% in September. A seller listing this month meets buyers facing a payment more than 12% higher than a year ago.
Retirement deadlines, in your inbox: Miss an enrollment or claim deadline and the money can be gone. Join the Retirement Money Brief and we’ll send you our 2026 Government Check Reality Tracker as a welcome gift.
Get the Brief + the check tracker →
We may earn a commission from links on this page.
What does “newly pending” actually measure?
A newly pending listing is a home that went from for sale to under contract during the month. Zillow says the count is not a tally of closed sales. It treats the number as a leading indicator of the following month’s closings, and October’s figure was also 9.1% below September’s.
The drop is about double the previous month’s. Zillow’s September report, issued Oct. 6, put newly pending sales down 8.5% from a year earlier. Going from 8.5% to 16.8% in a single month turned a soft autumn into the steepest annual decline in more than three years.
Closed sales have started to follow. Zillow’s preliminary nowcast has 304,105 existing homes selling in October, down 8.7% from a year earlier and 5.4% from September. The company says it will revise that estimate in mid-month as more records arrive, so the figure can still move.
The order of events matters. A contract signed in October closes later, so a buyer who backed out of the market last month will not show up as a lost closing until November or December. That lag is why Fisher’s warning about November carries weight even though the October sales estimate already shows a fall.
How much did the rate jump add to the monthly payment?
Zillow’s report cites Freddie Mac data for the October average of 7.33%, against 6.86% in September. Freddie Mac’s weekly survey put the 30-year fixed rate at 7.18% on Nov. 5, a shade under the prior week’s 7.24% but well above the 6.22% of a year ago.
At that borrowing cost, Zillow puts the typical monthly payment at $2,004 on a typically priced home with 20% down, not counting property taxes or insurance. That is 12.8% above last October and 4.8% above September. For a buyer putting 5% down on an FHA loan, Zillow says the payment rose about 11.8% over the year.
Zillow’s percentages imply the same house cost about $227 a month less to finance a year ago, or roughly $2,700 less over 12 months. The September report showed the payment growing at 6.7% a year, so the pace of increase nearly doubled in a month, as it did for the drop in contracts.
The monthly climb came in a month when the typical U.S. home value slipped 0.6%. A lower price did not offset the higher rate. The payment went up because of the cost of borrowing, not the cost of the house.
Is the worst of the slowdown over?
Mischa Fisher, Zillow’s chief economist, does not say so yet. He says “November is shaping up to have an even larger contraction,” and adds that “the silver lining is that next month is likely going to be the worst of it.”
Fisher also says he expects “the pace of the slowdown to ease into the new year.” Zillow’s release gives Dec. 4 as the date for its November report, the first full look at whether a slump in contracts has become a slump in closings.
The company saw this coming a month earlier. In the September report, Fisher said the for-sale market’s slowdown “was predictable given where mortgage rates currently stand,” and that release noted the month-end rate of 7.28% was the highest since November 2023, according to Freddie Mac.
What are sellers up against?
Homes that did go under contract took a median of 31 days to do it in October, two days longer than a year earlier. About 26.5% of listings carried a price cut, down slightly from 26.9% a year ago, so markdowns have not spread even as buyers pulled back.
Supply is building. About 1.4 million homes were for sale, with active inventory up 3.4% on the year, while new listings fell 4.2% to 328,328. Fisher says “there are deals to be had for buyers able to brave the affordability headwinds in the coming months,” and that “the continued inventory buildup means there is a lot of upside for sales into next year if we get rate relief.”
Homeowners who already have a mortgage do not see $2,004 on their own statements. The number describes what a buyer would take on today, which makes it a gauge of what a buyer can afford to pay for their house and part of the price of selling and moving.
Weighing a sale or a loan on your home with rates above 7%?
A 16.8% drop in contracts means a house listed now meets a thinner field of buyers than it did a year ago, while a 7% rate makes borrowing against the same house costlier. Owners who need cash have to choose between selling into a slow market and tapping equity at a high rate.
Cut Your House Costs puts home equity options compared, from a HELOC to a reverse mortgage, side by side in one guide. The 11-page guide also includes a home-cost audit worksheet and a section on selling without the tax, up to $250,000 of profit or $500,000 for a couple.
Get the guide that compares home equity options, from a HELOC to a reverse mortgage →
This article was produced with AI assistance and edited for accuracy against the sources linked above.