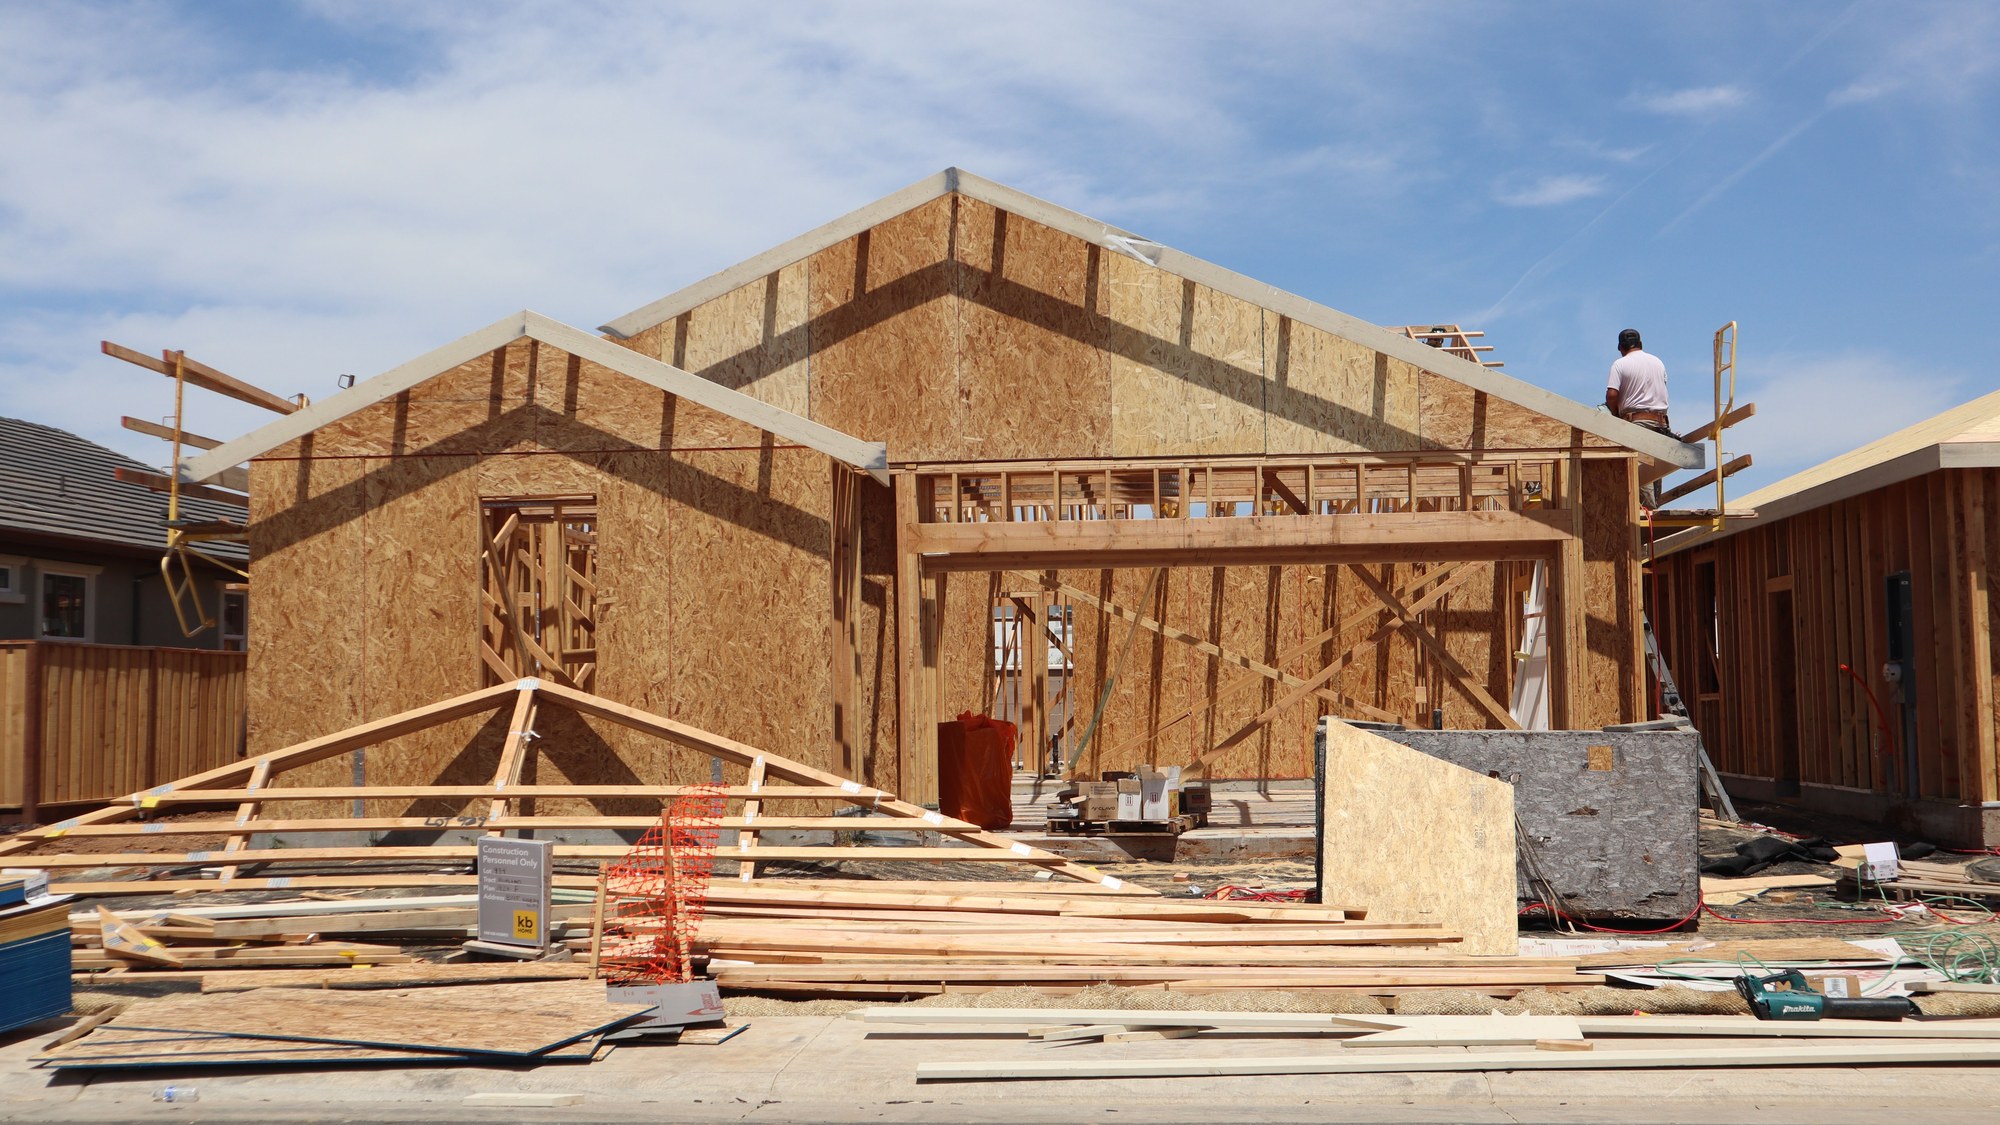
The Census Bureau says U.S. construction spending fell 1.9% in September to a seasonally adjusted annual rate of $2,186.1 billion, from a revised $2,227.4 billion in August. Residential construction took the biggest hit, dropping 5.5% to $848.8 billion. Total spending was also 2.7% below September 2025, the agency said in its Nov. 2 release.
The figures measure money spent on building sites, not home prices or household bills, but they show where that money was heading. A $49.2 billion fall in residential work outweighed the entire $41.3 billion decline in the total, because other private nonresidential projects rose. Anyone watching housing, building costs or the pace of new homes is looking at the same slowdown.
Stay ahead of government payment news: Miss an enrollment or claim deadline and the money can be gone. Join the Retirement Money Brief and we’ll send you our 2026 Government Check Reality Tracker as a welcome gift.
Get the Brief + the check tracker →
We may earn a commission from links on this page.
What makes up the $2,186.1 billion?
Private construction accounts for $1,639.3 billion of the total, down 2.4% from August, and public construction for $546.8 billion. Residential work at $848.8 billion is about 39% of everything built, and private nonresidential work at $790.6 billion is about 36%. Public projects make up the remaining quarter.
Against a year earlier, the total is $59.7 billion lower than the $2,245.8 billion of September 2025. Census puts the margin on the 2.7% annual decline at 1.5 percentage points, so the year-over-year decline is also outside the noise.
How big was the residential drop?
Residential construction ran at $848.8 billion in September, 5.5% below August’s revised $898.0 billion, according to Census. The margin of error on that change is 1.3 percentage points, so the decline is well outside the noise. It was the largest move of any major category in the report.
Residential spending, which was $115.7 billion above private nonresidential in August, is now only $58.2 billion above it. The gap between the two months is $49.2 billion at an annual rate. The “annual rate” wording matters: Census takes the pace of spending in a single month, adjusts for seasonal patterns and states it as if that pace held for 12 months. It is not the amount spent in September alone.
Is the slowdown in building showing up elsewhere in housing?
Other housing data released the same week point the same way. Zillow’s October market report, published Nov. 5, says newly pending listings fell 16.8% from a year earlier, the biggest annual drop since August 2023, and that mortgage rates averaged 7.33% in October.
Builders and buyers work in the same rate environment, though the Census release does not tie its decline to any single cause. Zillow’s report also shows active inventory up 3.4% from a year earlier, at about 1.4 million homes for sale.
Mischa Fisher, Zillow’s chief economist, says “November is shaping up to have an even larger contraction” in the housing market after October’s decline in contracts.
The two datasets measure different things. Census counts dollars spent on work in place, including projects started months earlier, while Zillow counts listings that went under contract in the month. That difference in timing is why the October construction figures, due Dec. 1, are the next test of whether September was a one-month dip.
Where did spending hold up?
Private nonresidential construction rose 1.1% to $790.6 billion from $782.3 billion in August. That category covers projects that are not housing and not government-built, and it was the only large piece of the report to grow. The $8.3 billion gain offset only about a sixth of the residential decline.
Public construction was essentially flat at $546.8 billion, 0.1% below August’s $547.1 billion. Educational building was unchanged at $113.1 billion, and highway spending slipped 0.3% to $149.2 billion from $149.7 billion. Together, school and highway work come to $262.3 billion, about 12% of all construction spending. Highway work is the larger of the two public pieces named in the release, at $149.2 billion against $113.1 billion for schools. Private construction as a whole came in at $1,639.3 billion, down 2.4%.
Did the August revision change the story, and how does the year look?
It did. Census compares September with a revised August figure of $2,227.4 billion. The news site investingLive reported that August was revised up to a 2.0% gain from the 0.9% first reported, which made September’s starting line higher and the fall bigger.
The same report put the forecast for September at a 0.3% gain, so a 1.9% decline was a surprise. Because each month is compared with a revised estimate of the one before, the September figure and the residential number can shift in later releases.
Through the first nine months of 2026, construction spending totaled $1,649.6 billion, 2.9% below the $1,698.6 billion of the same period in 2025. Census puts the margin on that comparison at 1.0 point, which keeps the year-to-date decline outside the noise as well. Spending ran about $49 billion lower over nine months than in the same stretch of 2025.
The next reading comes soon. Census’s release schedule lists the October figures for Dec. 1 at 10 a.m., the first look at whether residential work steadied or kept sliding after September’s 5.5% fall.
Is the housing slowdown reaching what your own home costs?
A 5.5% fall in residential building says nothing direct about any one household’s bills, so the turn here goes from the national slowdown to the one house a reader controls. Taxes, insurance and repairs keep arriving whether builders are busy or not.
Cut Your House Costs includes the home-cost audit worksheet, which lines up what a house costs in a year. The 11-page guide also covers home equity options compared from a HELOC to a reverse mortgage and an assessment appeal with the words to use at the hearing.
Get the home-cost audit worksheet for the house you already own →
This article was produced with AI assistance and edited for accuracy against the sources linked above.