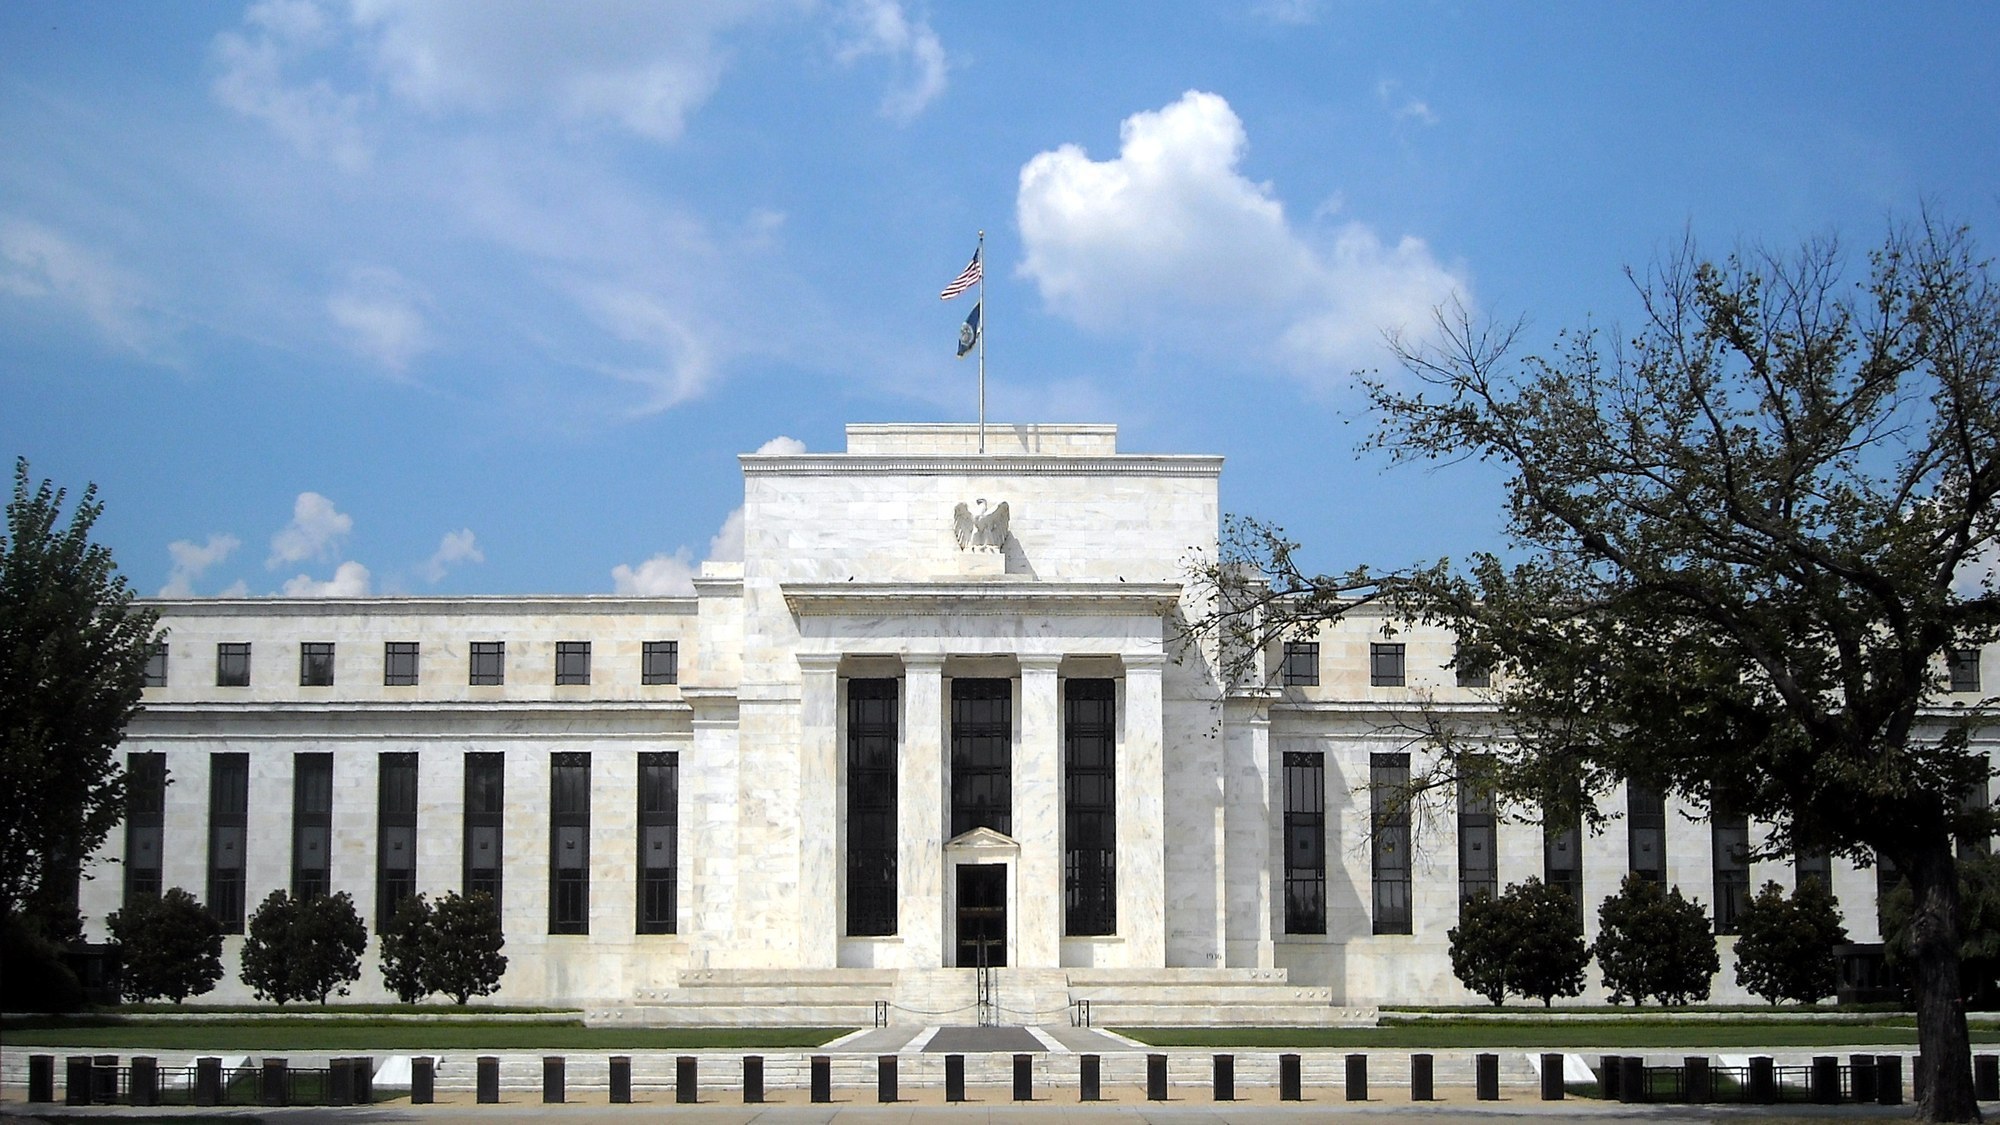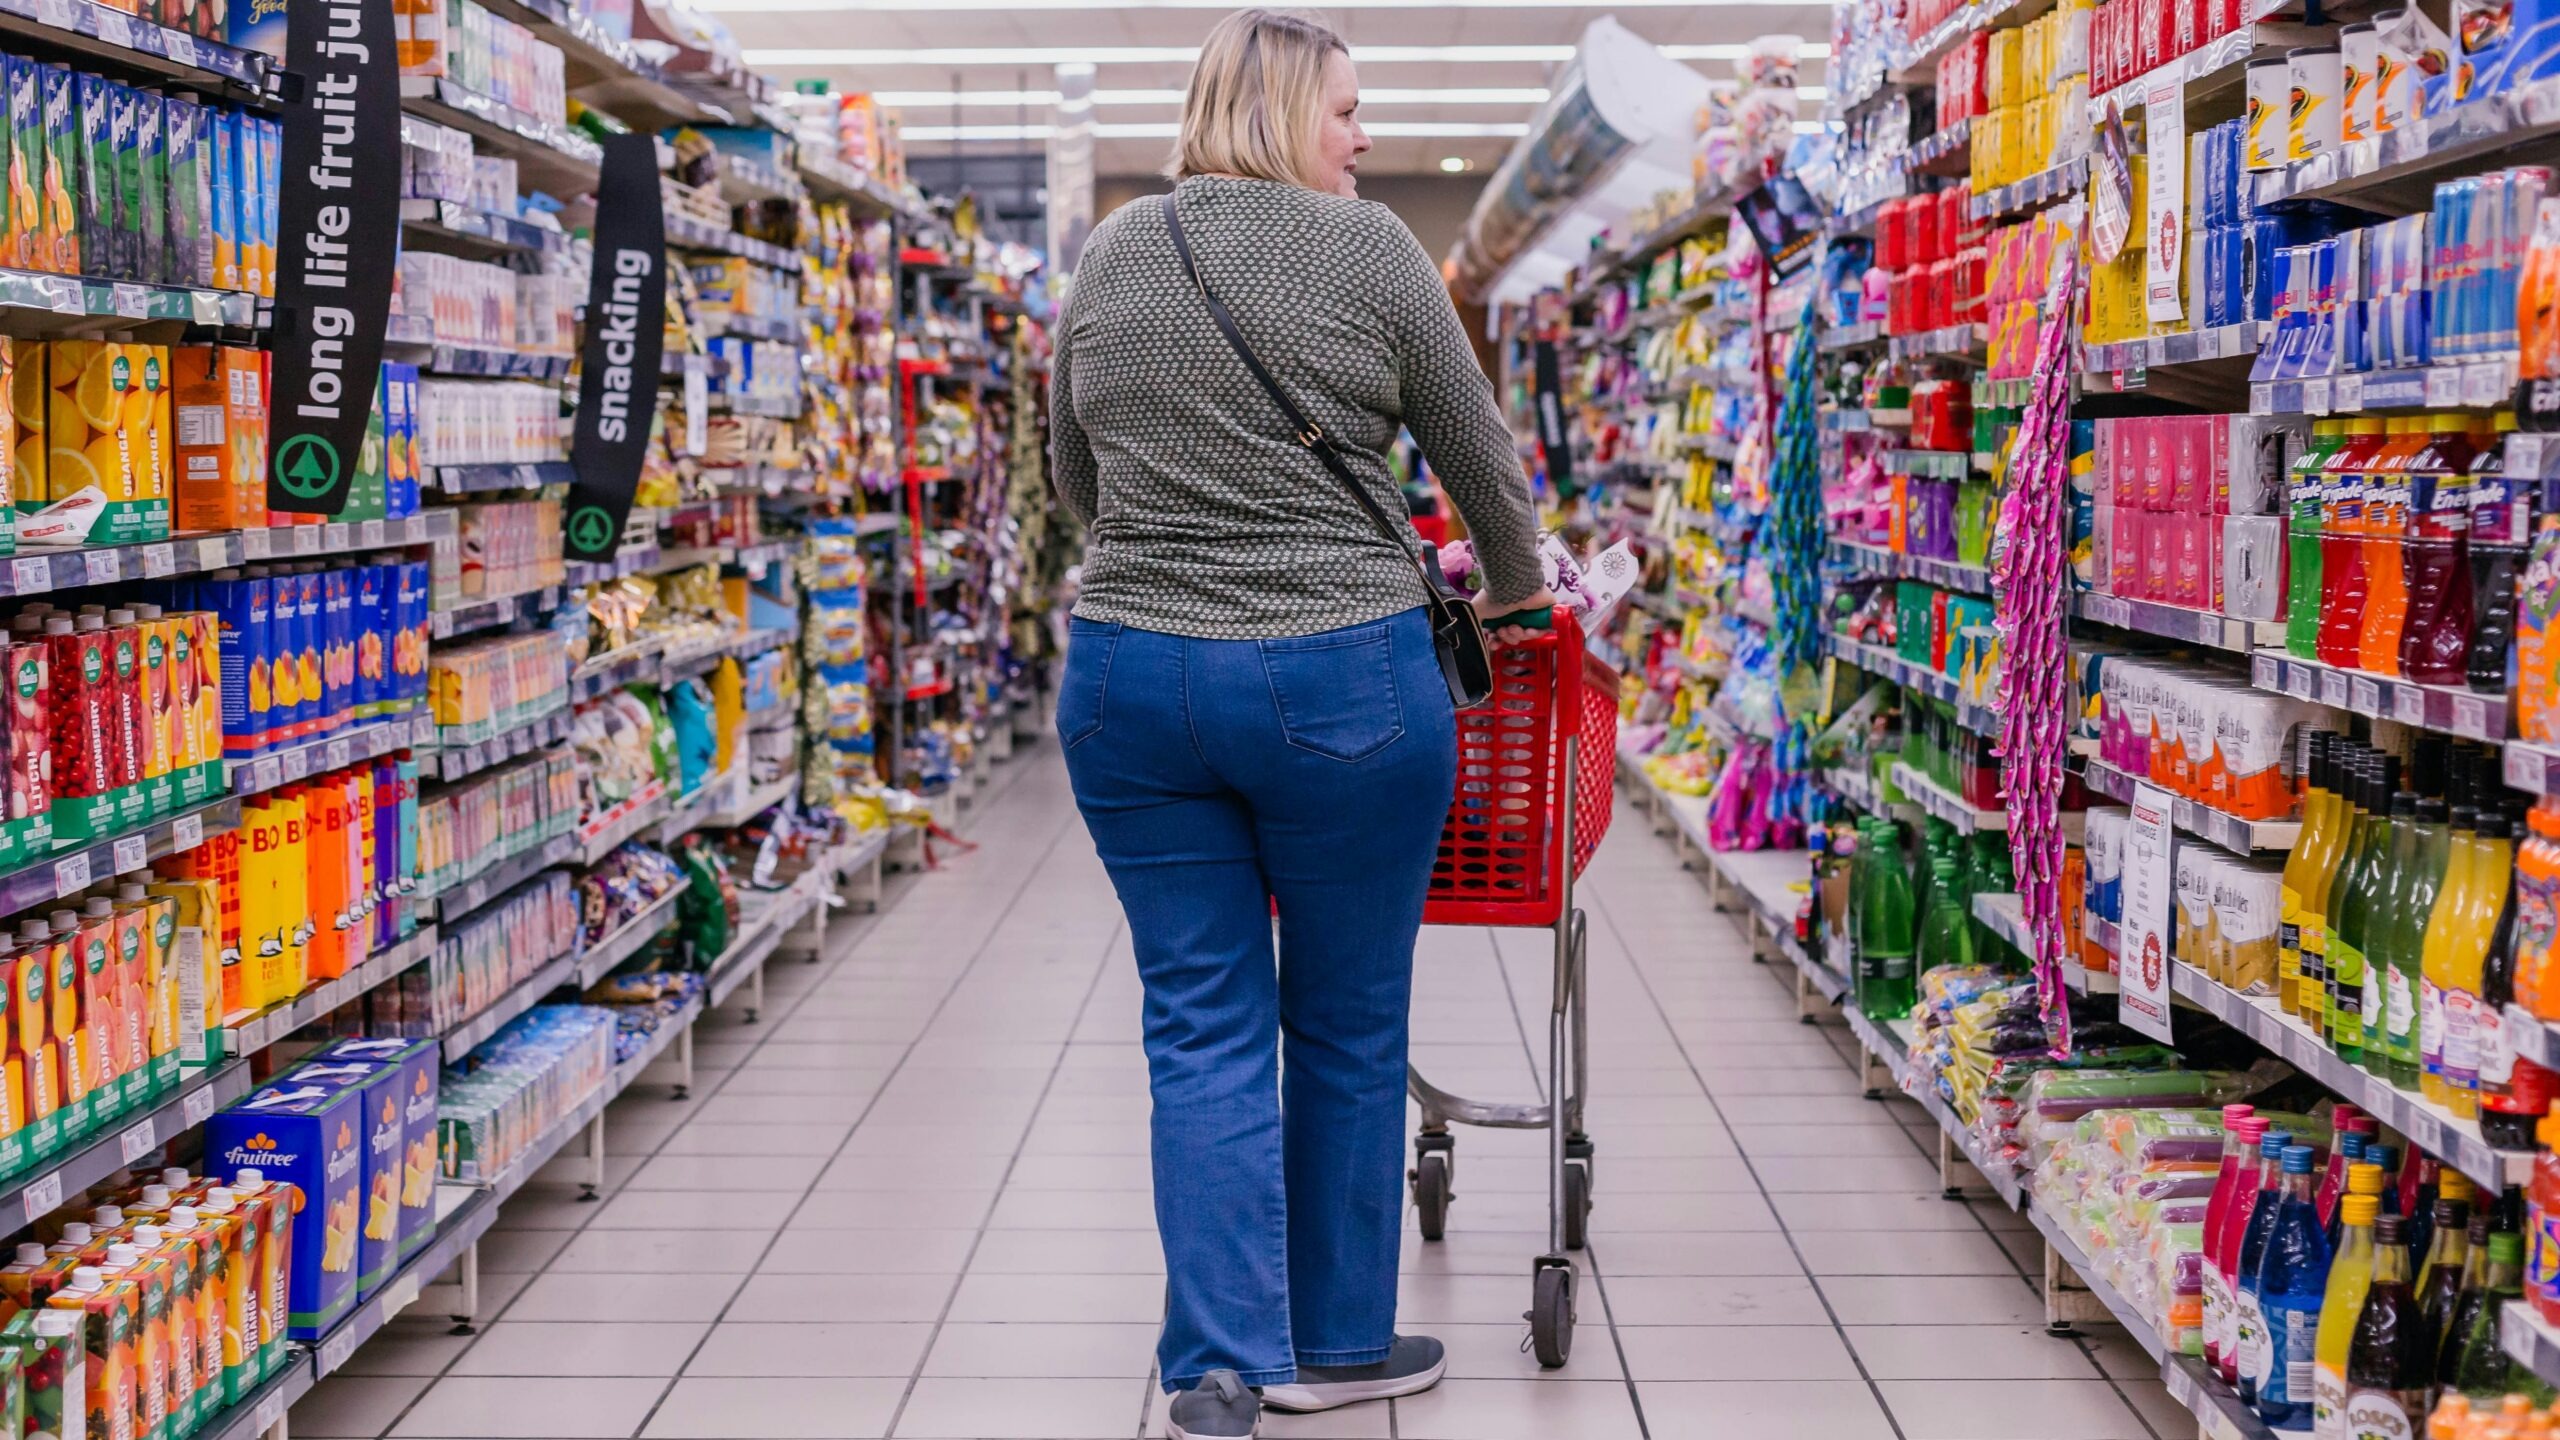
American households are paying sharply more for staple goods than they were at the start of the year. The Personal Consumption Expenditures price index, the Federal Reserve’s preferred inflation gauge, climbed from 2.9% year-over-year in February 2026 to 4.1% by May, a steep acceleration over just four months. Grocery prices, restaurant tabs, and broader consumer costs have all moved higher in tandem, squeezing budgets that were already stretched thin after years of cumulative price increases.
Four Months of Accelerating PCE Inflation and What It Means for Shoppers
The speed of the increase is what sets this period apart. In February, PCE inflation stood at 2.9% year-over-year. By March it had jumped to 3.5%, then 3.8% in April, before reaching 4.1% in May, according to the Bureau of Economic Analysis. That trajectory means the broadest measure of consumer prices re-accelerated by more than a full percentage point in roughly 120 days, a pace not seen since early 2022.
Food costs tell a parallel story. The Bureau of Labor Statistics reported that food-at-home prices, essentially the grocery bill, rose 2.7% over the 12 months through May 2026, with a modest 0.1% month-over-month gain. Eating out proved more expensive: food-away-from-home prices increased 3.5% year-over-year and 0.3% month-over-month, according to the USDA outlook. For a family splitting spending between groceries and restaurants, both channels are now running well above the Fed’s 2% target.
The practical effect is straightforward. A household spending $1,000 a month on goods and food at the start of the year now faces roughly $15 to $20 more per month in costs, based on the annualized PCE acceleration alone. That gap compounds across rent, utilities, and other fixed obligations that have their own price pressures. For middle-income consumers who do not have much room to cut back on essentials, the latest leg of inflation feels less like a statistical blip and more like a renewed tax on everyday life.
Higher prices also interact with wage growth in complicated ways. If paychecks are rising more slowly than the PCE index, real purchasing power erodes even when nominal incomes look higher on paper. Households that saw some relief when inflation cooled in 2024 may now feel that progress slipping away, prompting shifts in behavior such as trading down to store brands, delaying discretionary purchases, or dining out less often.
BLS Supplemental Data Reveals Category-Level Gaps Behind the Averages
National averages obscure wide variation across product categories and regions. The Bureau of Labor Statistics publishes detailed CPI supplemental tables in spreadsheet form, allowing analysts to audit exactly which goods categories drove the headline acceleration. Energy, shelter, and specific food subcategories each carry different weights in the overall index, and a shift in any one of those components can pull the national number sharply in either direction.
Looking under the hood, categories tied to global commodity markets-such as gasoline or certain processed foods-can swing rapidly month to month, while services like rent, medical care, and insurance tend to move more slowly but persistently. When both volatile and sticky components are rising at the same time, the result is a more entrenched inflation environment that is harder for households to navigate and for policymakers to tame.
The USDA’s Food-at-Home Monthly Area Prices dataset, known as F-MAP, adds geographic texture. Unit-value prices and regional price indexes tracked by F-MAP show that not every city or food group experienced the same rate of increase. Some metro areas saw grocery inflation well above the 2.7% national average, while others stayed closer to flat. That dispersion matters because it determines whether the acceleration is broad-based or driven by localized supply disruptions in a handful of staple categories.
For example, a spike in prices for eggs or fresh vegetables in one region might reflect weather-related crop issues or transportation bottlenecks, while stable prices in another region signal more resilient supply chains. Similarly, urban areas with tight housing markets can experience faster increases in shelter costs, magnifying the impact of food and energy inflation and leaving residents with less flexibility to absorb higher bills.
For shoppers, these nuances translate into very different lived experiences of the same national inflation rate. A household in a high-rent metro area that also happens to be facing above-average grocery inflation will feel the squeeze more acutely than a counterpart in a region where housing and food prices are relatively subdued. Even within a single city, households that rely heavily on restaurants, prepared foods, or commuting by car will see different pressure points than those who cook at home and use public transit.
The combination of a re-accelerating PCE index, steady increases in both grocery and restaurant prices, and uneven regional trends underscores why inflation remains a central concern for consumers. While headline numbers help frame the national story, the detailed data behind them-broken out by category and geography-ultimately determine how painful each additional percentage point of inflation feels at the checkout line.