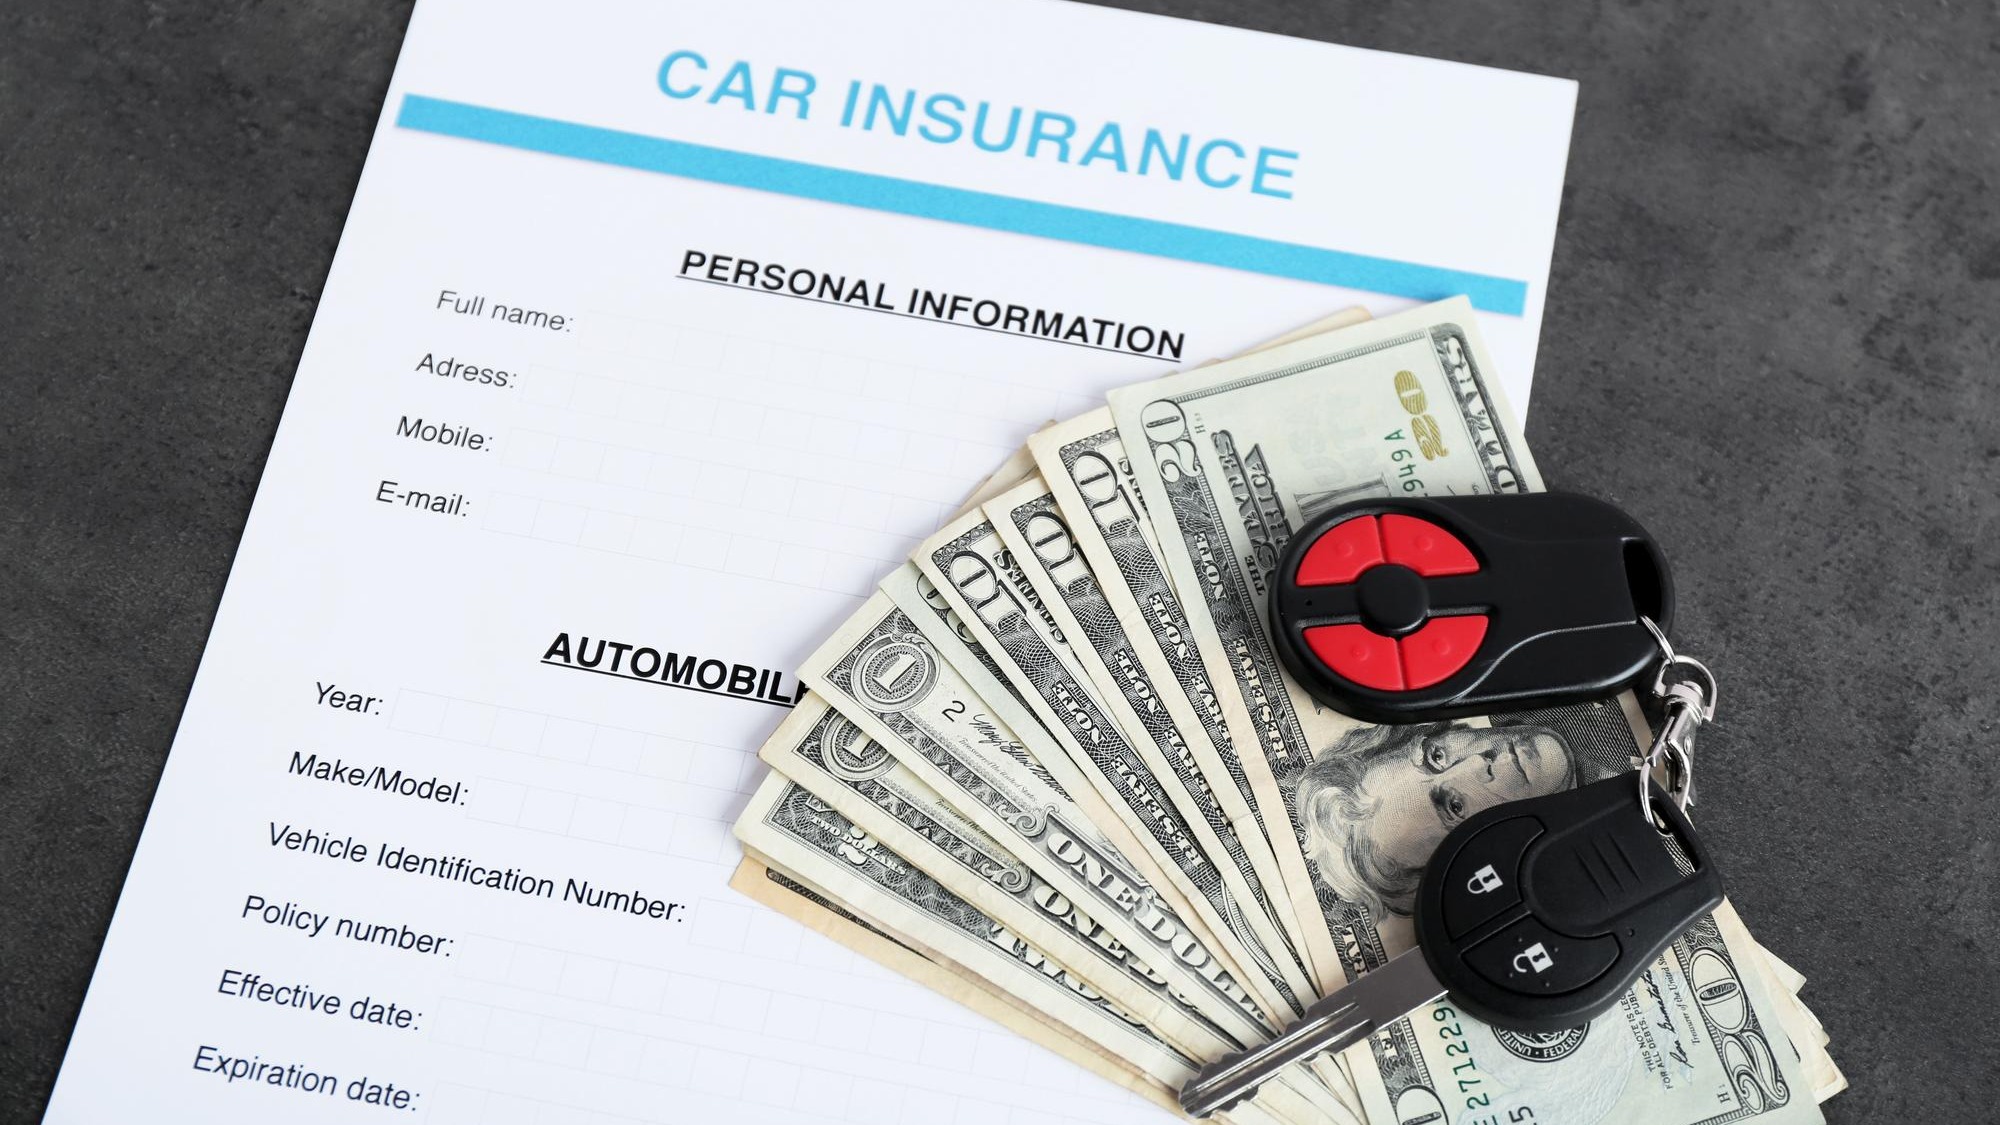
American drivers now pay sharply more to insure their cars than they did just five years ago. The U.S. Bureau of Labor Statistics motor vehicle insurance component of the Consumer Price Index has climbed 64 percent over that span, a pace that dwarfs the broader CPI-U increase for all items. The gap between what households spend on coverage and what they spend on almost everything else has widened into one of the most lopsided price pressures in the consumer economy.
How a 64 percent insurance spike squeezes household budgets
The BLS tracks what consumers actually pay for auto insurance after accounting for coverage changes and sampling rotation, as detailed in the agency’s technical documentation. That methodology means the 64 percent figure is not a rough estimate or an industry talking point. It reflects the prices real policyholders encounter at renewal time, weighted across plan types and geographic areas.
General inflation, by contrast, has risen far less over the same window. The result is a cost category that consumes a growing share of take-home pay, especially for households that depend on personal vehicles for commuting, childcare, or medical appointments. Because most states require minimum liability coverage, drivers cannot simply opt out the way they might skip a restaurant meal or delay a new appliance purchase.
One hypothesis worth testing is whether the spread of usage-based or telematics insurance programs has quietly amplified the pain for certain drivers. Programs that price coverage on mileage, braking habits, or time-of-day driving can raise premiums for high-risk or high-mileage motorists by more than the headline index suggests. Matching telematics adoption rates against the BLS CPI time series sub-components over the same five-year period could reveal whether the national average masks sharper increases for specific driver profiles. No publicly available BLS dataset currently breaks the index down by telematics status, so that question remains open.
What the BLS data shows and what it leaves out
The core evidence sits in the BLS CPI “cu” bulk files, which any researcher or newsroom can download and audit independently. Those files, accessible through the main CPI data portal, list index levels and percentage changes for motor vehicle insurance alongside hundreds of other consumer categories. The August 2024 CPI news release included motor vehicle insurance as a line item with its 12-month percentage change and index level, confirming the trend was still accelerating at that point. These releases and bulk files are the canonical published artifacts for verifying the five-year calculation, and they underpin most secondary reporting on insurance inflation.
The data does have boundaries. The CPI motor vehicle insurance index is a national average. It does not break results down by state, insurer, or cause of loss. That means the 64 percent figure cannot, on its own, explain how much of the increase stems from higher vehicle repair costs, more frequent severe-weather claims, or rising litigation expenses. Each of those factors has been cited in industry commentary, but the BLS releases and bulk files contain no cause-of-loss decomposition that would assign weight to any single driver.
Direct statements from insurers or state regulators about pricing decisions are also absent from the federal data. Secondary news accounts have flagged year-over-year premium spikes that align with the CPI trend, but the official index measures price outcomes, not the corporate reasoning behind them. To move from description to explanation, analysts have to combine the CPI series with other datasets, such as repair cost indices, accident frequency statistics, or state-level rate filings. Even then, causality can be hard to untangle.
For journalists and independent researchers, the BLS Public Data API adds another layer of transparency. Using the documented API interface, it is possible to pull the motor vehicle insurance series directly into spreadsheets or code notebooks, automate five-year change calculations, and test how sensitive the results are to different starting points. That kind of reproducible workflow is essential when a single headline number-“up 64 percent”-carries major implications for public debates about affordability and regulation.
Open questions for drivers watching their next renewal
The BLS figures confirm that auto insurance has become one of the fastest-rising line items in household budgets, but they stop short of answering the questions most drivers care about. Why did a particular premium jump by hundreds of dollars in a single year? How much of that increase reflects individual risk factors, and how much reflects broad market shifts that no one driver can control?
Because the CPI index is an average, it can conceal wide disparities. A low-mileage driver in a rural area with a clean record may see smaller increases than the national figure, while an urban commuter with a long daily drive could face far steeper hikes. Telematics programs may further segment outcomes, rewarding some drivers with discounts while penalizing others whose habits trigger algorithmic red flags. Without disaggregated federal data, those distributional effects remain largely a matter of case-by-case experience and scattered state filings.
For now, the most concrete takeaway from the BLS data is that auto coverage is likely to remain a pressure point in family finances even if overall inflation continues to cool. Households can shop around, adjust deductibles, or tweak coverage limits, but they cannot easily escape a market in which the underlying price level has shifted so dramatically. As renewal notices arrive in the mail or inbox, the 64 percent five-year climb in the CPI index offers a sobering backdrop-and a reminder that, for many drivers, the cost of simply staying insured has become a story in its own right.