The S&P 500 gained 653.86 points, or 9.6%, during the first half of 2026, closing out its strongest opening six months since 2021. That broad rally, however, masked a sharp late-June selloff in semiconductor stocks that rattled growth-heavy portfolios and raised questions about whether the index’s gains are built on increasingly narrow foundations.
First-half gains and the gap they conceal
The index’s 9.6% advance was measured from its close on December 31, 2025, through its close on June 30, 2026, based on the S&P 500 price series maintained by the Federal Reserve Bank of St. Louis. Tuesday’s session capped the half-year run, with the S&P 500 finishing up 653.86 points year to date alongside gains in the Dow, Nasdaq, and Russell indexes.
A 9.6% first-half return is strong by historical standards, but the number alone does not reveal how concentrated the advance has been. Mega-cap growth names, particularly in technology, drove a disproportionate share of the move. When chipmakers sold off sharply during the final week of June, the divergence between those heavyweight stocks and the broader value universe became harder to ignore. If labor-market data triggers a reassessment of Federal Reserve rate expectations, the valuation gap between growth and value sectors could widen further, because rate-sensitive growth stocks respond more dramatically to shifts in discount-rate assumptions.
Chip selloff and the jobs report that followed
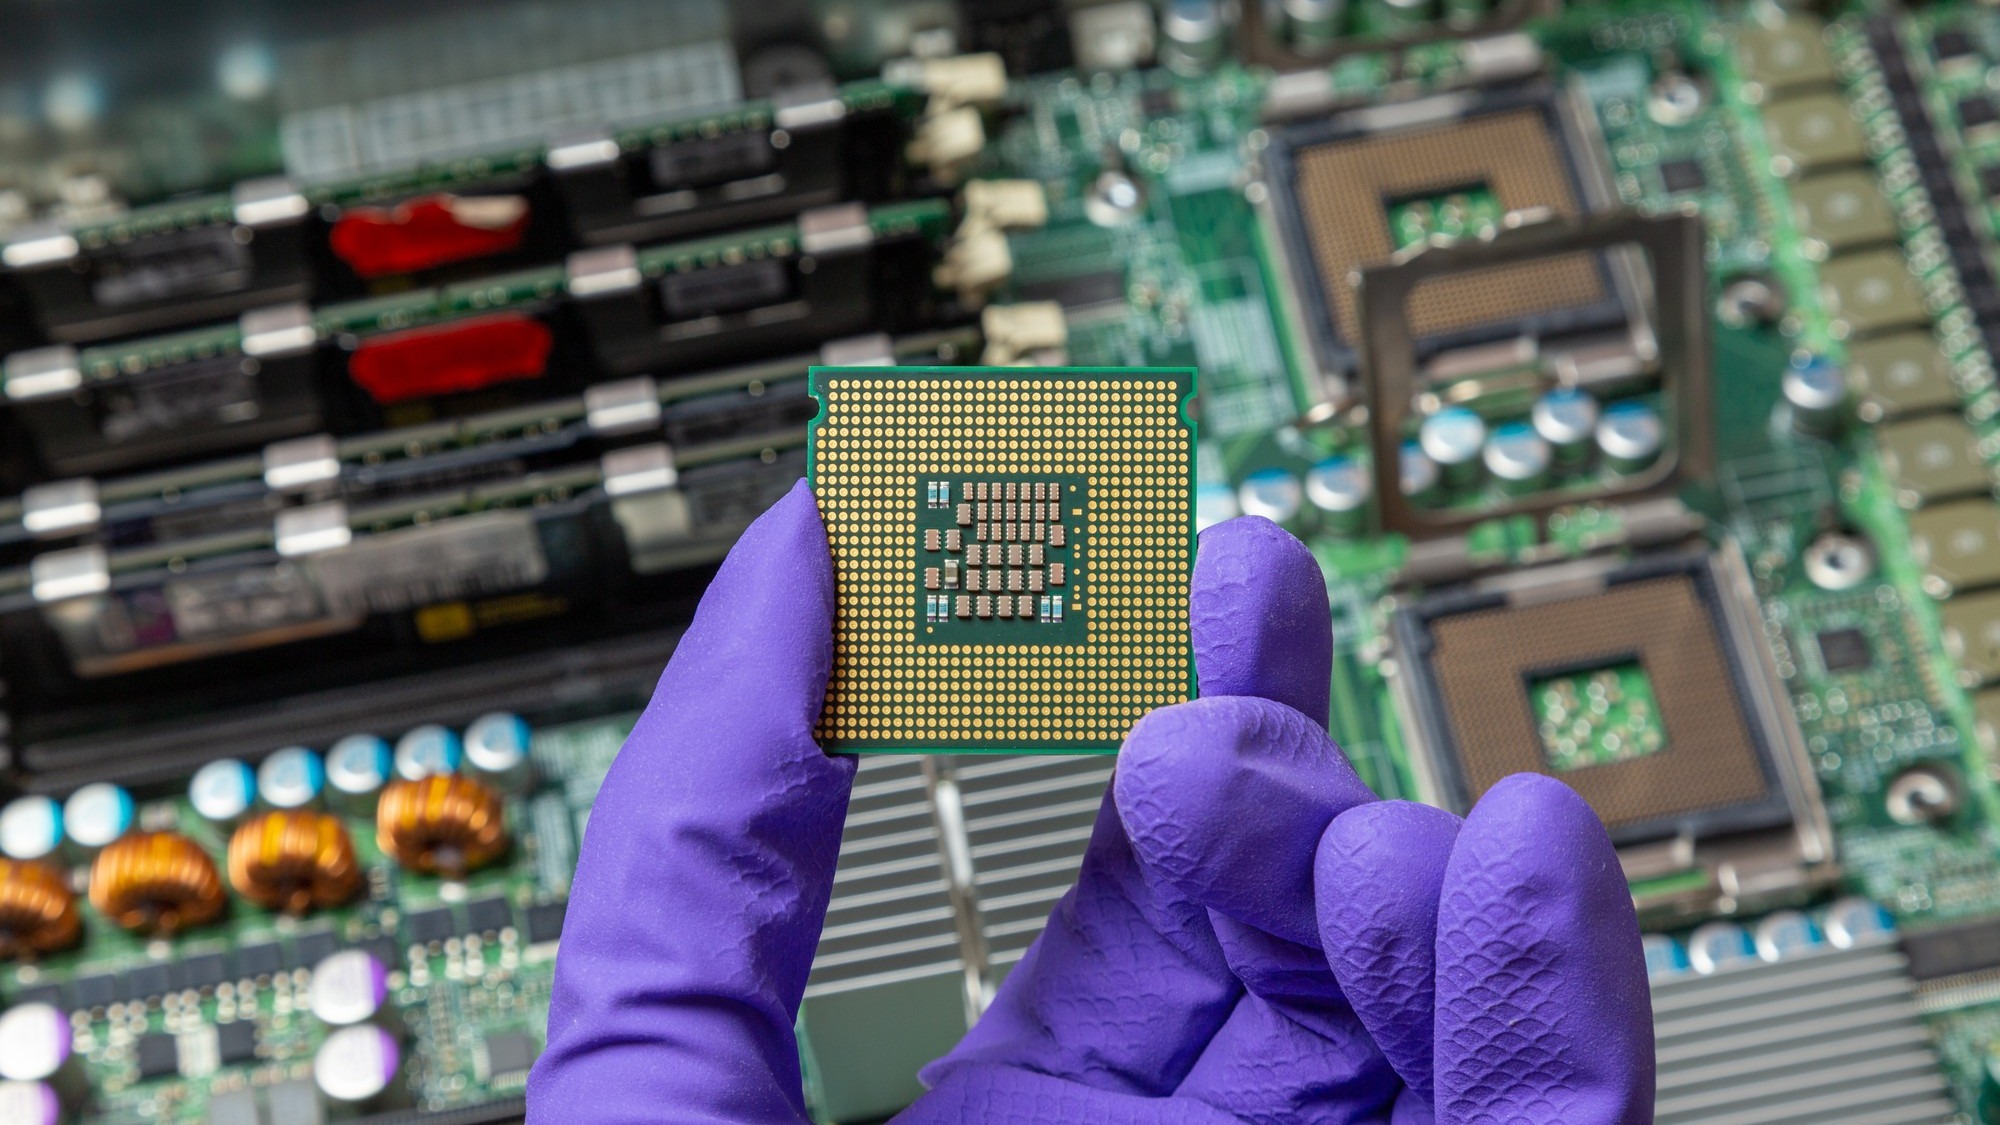
Semiconductor weakness surfaced during a risk-off session earlier in June and intensified as the half drew to a close. The selling pressure in chip stocks stood in contrast to the index-level strength, illustrating how a handful of large-cap names can keep headline numbers elevated even while entire sectors retreat. For investors who had leaned heavily into artificial-intelligence plays and related hardware suppliers, the late-June reversal erased weeks of outperformance in a matter of days.
The Bureau of Labor Statistics released its June 2026 Employment Situation report on July 2, one trading day after the half-year mark. That report contains payroll totals, the unemployment rate, and labor-force participation figures that feed directly into models used to price growth stocks. A hotter-than-expected labor market would push rate-cut expectations further out, pressuring the same high-multiple names that powered the first-half rally. A cooler reading would do the opposite, potentially reigniting demand for the very chip stocks that sold off.
The timing matters. Markets closed the first half before absorbing the full employment data, meaning the 9.6% figure reflects investor positioning ahead of, not in response to, the jobs numbers. Any revision to labor statistics later this year, particularly during the annual benchmark process, could retroactively reshape how analysts view the sustainability of first-half gains. The BLS maintains a rolling release schedule for jobs data, and each new installment has the potential to alter expectations for interest rates, corporate earnings, and sector leadership.
Unresolved questions heading into the second half
Several gaps in the available evidence limit how far conclusions can stretch. The FRED series provides daily closing prices but does not break out sector contributions to the S&P 500’s performance, leaving investors to infer how much of the 9.6% gain came from a narrow group of technology and communication-services names. Index-level data also obscure dispersion between equal-weight and capitalization-weighted versions of the benchmark, a key measure of how broad or narrow a rally truly is.
At the same time, the June employment report offers only a snapshot of labor-market conditions around the survey week. It cannot fully capture how employers and workers will react to evolving financial conditions in the second half, nor can it predict how quickly wage trends might feed through to inflation. Those unknowns matter for equity valuations: if wage growth remains firm while productivity disappoints, profit margins could compress even if headline economic growth holds up.
Investors are also wrestling with the durability of the semiconductor story itself. The late-June selloff may reflect profit-taking after an extended run, a reassessment of demand for advanced chips, or simply a repricing of risk as policy uncertainty rises. Without clearer evidence from corporate earnings and capital-expenditure plans, it is difficult to distinguish between a healthy correction within an ongoing uptrend and the early stages of a more protracted unwind in growth leadership.
For now, the first half of 2026 can be summarized as a strong index-level advance resting on an increasingly uneven foundation. The S&P 500’s 9.6% gain signals resilience in aggregate, but the underlying crosscurrents-between growth and value, chips and the rest of the market, and employment data and rate expectations-suggest a more fragile equilibrium. As the second half unfolds, the interaction between new labor-market releases, central-bank messaging, and sector-specific news will determine whether June’s semiconductor stumble proves to be a brief detour or an early warning that the rally’s base is narrowing further.