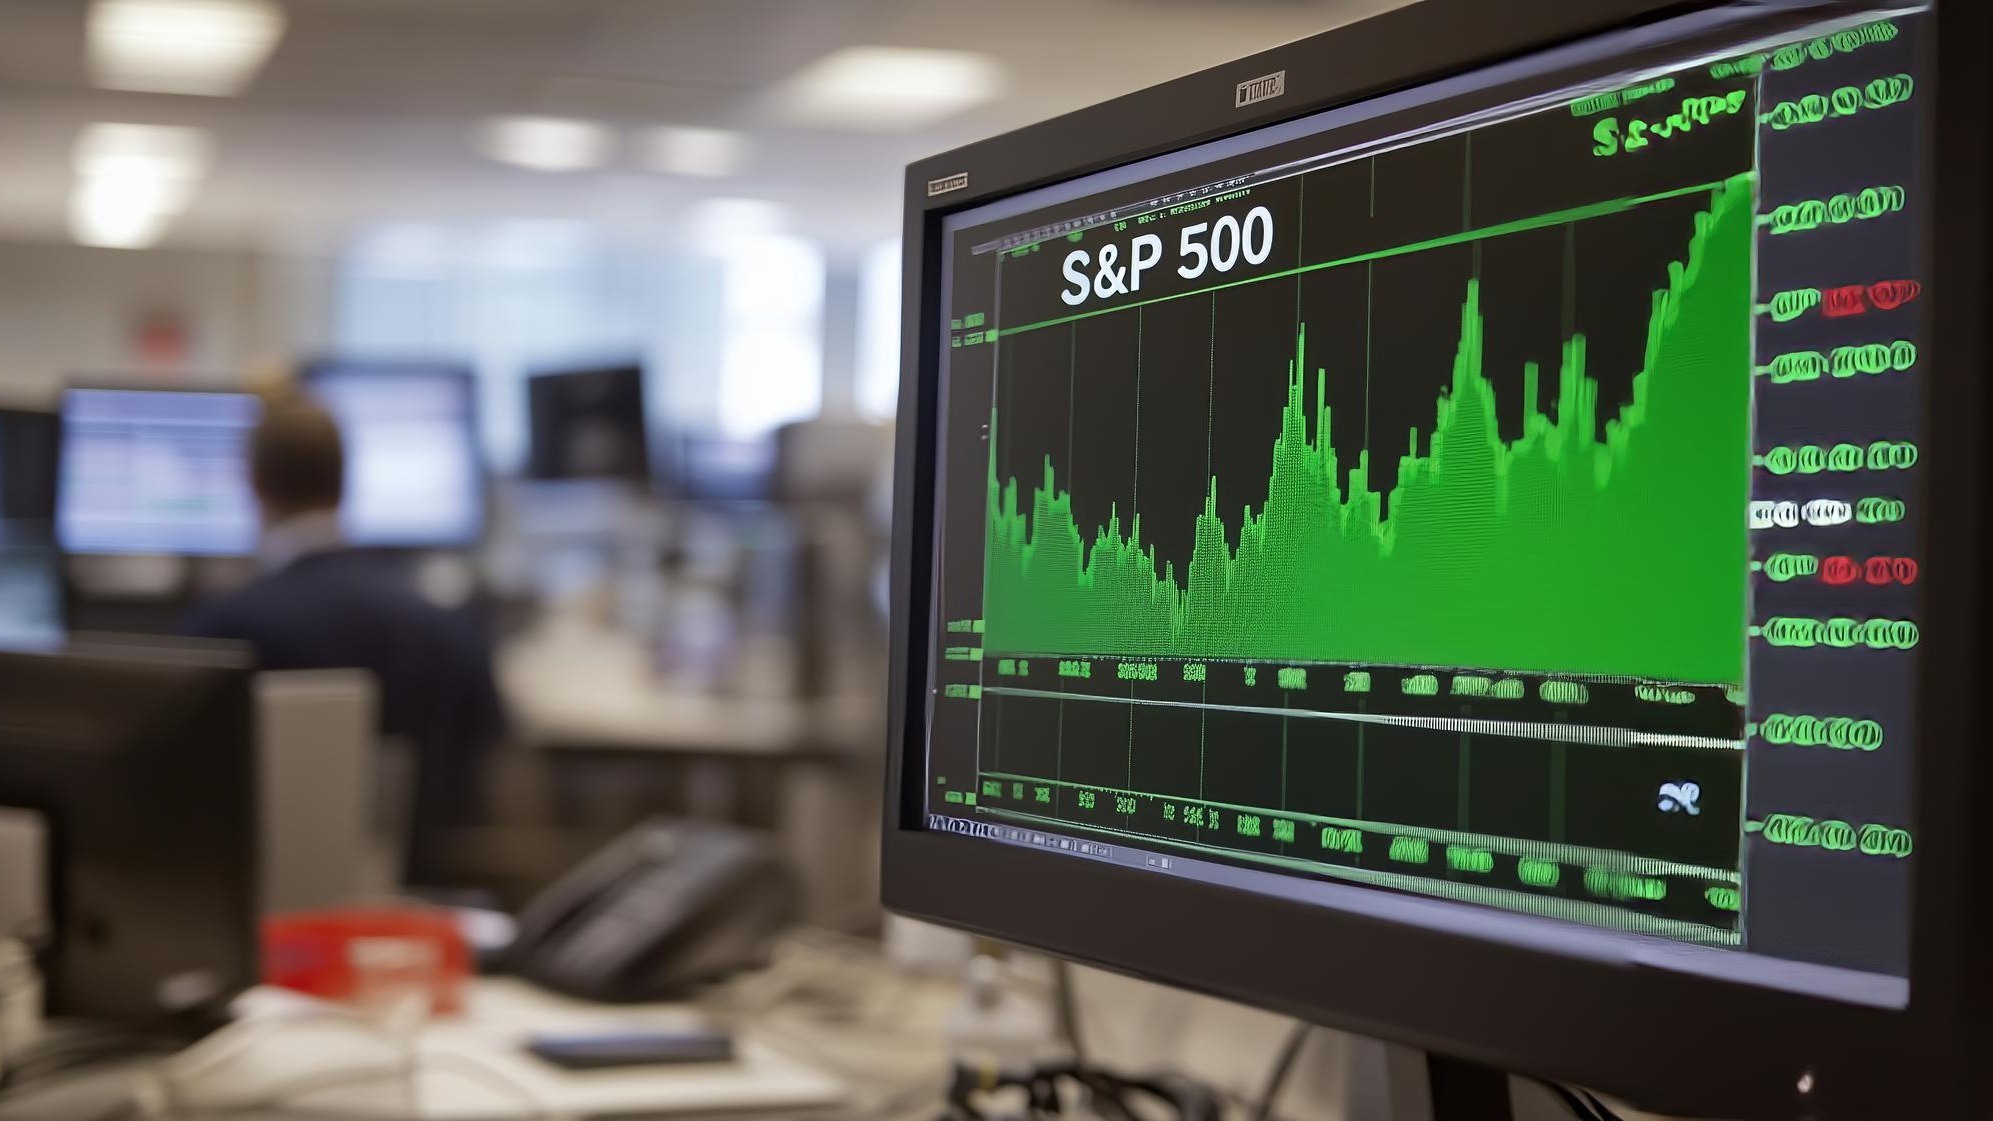
The S&P 500 is supposed to be the definition of a diversified investment, a single fund that spreads money across 500 of America’s largest companies. In practice, it has become something narrower. A small cluster of giant technology and growth companies now carries an outsized share of the index, so much so that the fortunes of a few names increasingly steer the whole market.
That concentration has grown to levels that have caught the attention of strategists who study market history. For the millions of older Americans who hold S&P 500 index funds in retirement accounts, the shift matters, because a fund that looks broadly diversified may be quietly resting on a handful of stocks.
How lopsided the index has become
By recent measures, the ten largest companies in the S&P 500 account for well over a third of the entire index, with some tallies putting the figure closer to 40%. Analysts at J.P. Morgan Asset Management have described the current top-heavy structure as extreme by historical standards, noting how far the leading names now tower over the rest of the market.
The index is weighted by market value, which means the biggest companies automatically get the biggest slice. As those leaders have soared, their combined weight has climbed to roughly double what it was less than a decade ago. Data compiled by Pensions & Investments shows the top ten commanding a share of the index that dwarfs the broad middle of the 500.
A comparison to past market peaks
What unnerves some observers is where that concentration sits relative to history. A review of crash risk factors has framed today’s top-ten weighting as heavier than the concentration seen before the 1929 crash and during the dot-com bubble that peaked in 2000, when the largest names made up a much smaller share of the market than they do now. By most accounts, the top ten held somewhere in the mid-to-high 20s as a percentage of the index at the 2000 peak, well below current levels.
The comparison is not a forecast, and concentration alone does not guarantee a downturn. Markets have run for long stretches with a few dominant leaders, and today’s giants are far more profitable than the speculative names that led the 1999 mania. Still, the historical echo is why the topic keeps surfacing: past periods of extreme concentration have often been followed by rocky stretches once the leaders stumbled.
Why concentration raises the stakes
The practical risk is straightforward. When a handful of stocks drive most of an index, the index rises and falls largely on their performance. A broad market fund that appears to spread risk across hundreds of companies can behave, in a downturn, more like a bet on a few mega-cap names. If those leaders sell off, the whole fund drops with them, and the smaller companies underneath provide little cushion.
That dynamic cuts both ways, which is part of why it has persisted. The same concentration that magnifies losses when the leaders fall has amplified gains on the way up, rewarding investors who held the index through the run. The concern is what happens on the other side, when the crowd that pushed a few stocks to record valuations decides to head for the exits at the same time.
The gap shows up in a simple comparison. A standard S&P 500 fund weights companies by size, so the biggest names dominate, while an equal-weight version of the same 500 companies gives each one the same small slice. When the mega-caps lead, the cap-weighted fund pulls ahead and the equal-weight version lags; when the leaders stumble, the relationship can flip. An investor who owns only the cap-weighted index is, in effect, making a larger bet on the biggest stocks than the label “500 companies” suggests, which is why the two versions can post noticeably different returns in the same year.
What it means for retirement savers
For an older saver, the takeaway is not to abandon index funds, which remain a low-cost, sensible core for many portfolios. It is to understand what a broad-market fund actually holds today and to check whether a nest egg is more exposed to a few stocks than it appears.
One step is to look at overlap. An investor who owns an S&P 500 fund, a technology fund and shares of a couple of large tech companies may be tripling down on the same handful of names without realizing it. Adding up how much of a portfolio ultimately rides on the biggest stocks can reveal a concentration that no single holding makes obvious.
Diversifying beyond the largest names is another. Funds that weight companies equally rather than by size, holdings in smaller companies, international stocks and bonds all reduce reliance on the mega-caps. For retirees drawing income, that spread matters because a sharp drop concentrated in a few stocks could hit a portfolio just when withdrawals are underway, the sequence-of-returns risk that does the most damage early in retirement.
None of this calls for a dramatic overhaul in response to a single statistic. The steadier approach is to review an allocation against an actual timeline, confirm that near-term spending sits in stable holdings, and decide how much exposure to the market’s narrow leadership a household is comfortable carrying. A retiree who is already relying on withdrawals has more reason to spread risk than a younger saver with time to recover, since a concentrated drop early in retirement is harder to make back. Even a small shift toward broader holdings can lower the odds that a stumble in a few stocks reshapes a household’s plans.
The concentration of the S&P 500 is a real feature of today’s market, not a prediction of what comes next. But it is a reason for savers to look past the reassuring word “diversified” and check what their broad-market funds are really built on.
This article was produced with AI assistance and reviewed against the cited primary and reported sources before publication.
Free tool for readers: You check your blood pressure — when did you last check your retirement? You can get your free Retirement Safety Score in about five minutes, with no sign-up to see it.