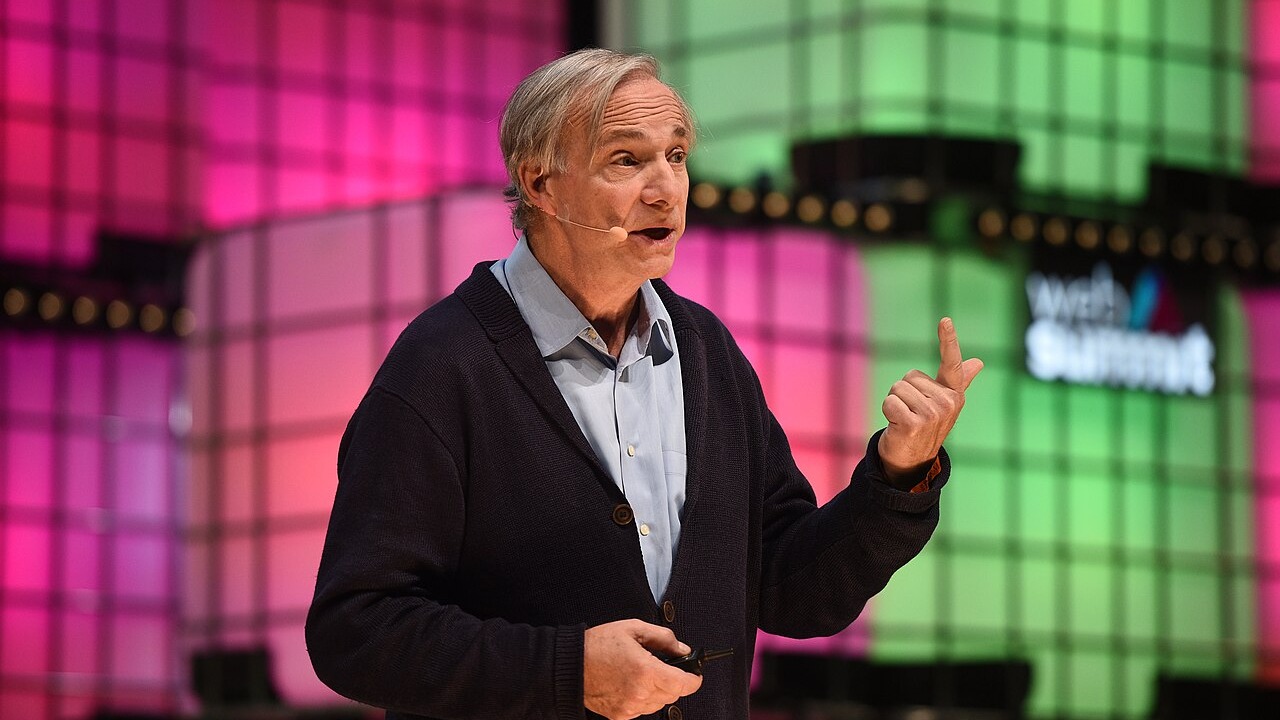
Ray Dalio has spent decades studying the anatomy of market manias, so it carries weight when his own measuring stick starts to flash. The founder of Bridgewater Associates, the world’s largest hedge fund, says the proprietary “bubble gauge” he uses to grade the U.S. stock market has climbed to around the 77th percentile of its historical range, the highest reading of the current cycle.
That figure sits below the extremes of the past. In both the 1929 mania that preceded the Great Depression and the 2000 dot-com peak, Dalio’s aggregate gauge registered at the 100th percentile, its maximum. The market today, by his math, is elevated and drifting toward those danger zones without yet matching them.
For retirees and near-retirees, the useful question is not whether a famous investor has turned cautious. It is what a gauge like this actually measures, and how a warning of this kind should be weighed without triggering a panicked sell-off that does more harm than the risk it is meant to guard against.
What the bubble gauge actually measures
Dalio’s indicator is not a single number pulled from a stock chart. As he has explained in his research on market bubbles, the gauge blends several conditions that have historically appeared together at true tops: prices that are high relative to traditional measures of value, prices that already assume rapidly accelerating future earnings, a flood of new and inexperienced buyers entering the market, broadly bullish sentiment, purchases financed with borrowed money, and businesses or investors stretching to buy in anticipation of further price rises.
Each of those pieces is scored and combined, then ranked against history so that the reading lands somewhere between zero and 100. The framework, laid out in Bridgewater’s detailed explanation of the gauge, is designed to answer a specific question: how closely do current conditions resemble the classic pattern that has preceded past busts. A high reading does not forecast the day a decline begins. It describes how much a market looks like earlier setups that ended badly.
Reading the numbers behind the headline
The 77th-percentile figure refers to the market as a whole. A separate component that tracks how expensive prices are on their own, essentially a valuation gauge, sits higher, at roughly the 82nd percentile in Dalio’s telling. Both are elevated, and both remain short of the 100th-percentile readings recorded at the 1929 and 2000 peaks.
An average, though, can hide sharp differences underneath it. Dalio has stressed that the aggregate reading masks wide variation among individual stocks. Some names, particularly a cluster of emerging technology companies riding enormous expectations, look to him like they are in genuine bubbles by these measures. Others do not appear stretched at all. That split matters for anyone whose portfolio has quietly become concentrated in a handful of the largest, most popular stocks, because the risk Dalio is describing is not spread evenly across the market.
Why measured caution beats a snap reaction
Warnings from marquee investors deserve context as much as attention. Dalio has issued cautious calls before, and reputable forecasters have flagged bubbles that took years to deflate or that never burst on the predicted timeline. His broader argument, detailed in Fortune’s account of his remarks, ties the stock market’s condition to a larger worry about government debt and the strain it places on the financial system, a slower-moving concern than a market top.
The practical hazard for an ordinary saver is overreaction. An investor who sold everything on similar warnings a few years ago would have surrendered a large share of the gains that followed. Moving a whole portfolio to cash on a headline can also lock in losses, trigger avoidable taxes, and leave a household on the sidelines when markets recover, which they historically have done. A gauge at the 77th percentile is a reason to review risk deliberately, not a signal to act on impulse.
What an elevated gauge means for a retirement portfolio
The most constructive response is to translate a broad market warning into specific questions about a household’s own money. A retiree heavily concentrated in a few large technology stocks carries more downside than one whose holdings are spread across sectors, company sizes, and asset types. Checking how much of a nest egg rides on the same handful of names that Dalio singles out is a concrete first step.
Diversification is the ordinary defense against exactly the outcome a bubble gauge is built to warn about. Spreading money across stocks, shorter-term bonds, and cash reduces the odds that one bad year in a single corner of the market erases a large slice of savings. Sequence-of-returns risk, the danger of drawing down a portfolio during a downturn early in retirement, makes that spread especially important for people who have recently stopped working or are about to. A slump that a younger worker can wait out can be far more damaging to someone withdrawing money to cover living costs at the same time.
Matching risk to an actual timeline is the other piece. The U.S. Securities and Exchange Commission’s investor education arm walks through how to assess personal risk tolerance, weighing how much volatility a household can absorb against when the money will be needed. A saver who will draw on a portfolio next year and one who will not touch it for a decade should reasonably read the same warning very differently.
The takeaway
Dalio’s gauge is a thermometer, not a stopwatch. It reports that U.S. stocks now sit closer to the historical bubble pattern than they have in this cycle, while still trailing the 1929 and 2000 extremes and hiding real differences between individual stocks. That is a genuine signal worth respecting.
It is not, on its own, an instruction to abandon the market. The steadier use of a reading like this is as a prompt to confirm that near-term spending is covered by stable holdings, that a portfolio is not quietly overexposed to the most inflated corners of the market, and that the overall mix still fits the household’s timeline. Those checks serve savers whether or not a top arrives on any famous investor’s schedule.
This article was produced with AI assistance and reviewed against the cited sources before publication.
Before you go: most people check a credit score more often than a retirement plan. A free Retirement Safety Score takes about five minutes and needs no sign-up to view.