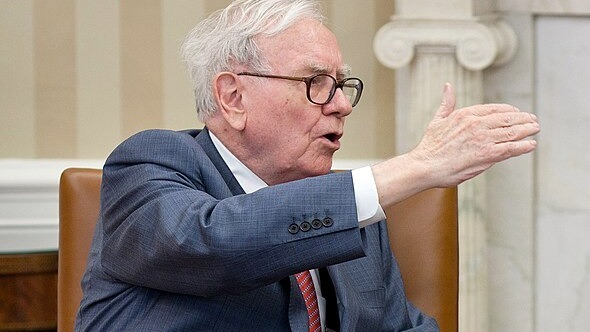
Warren Buffett’s warning that finding value is difficult “when everybody is preferring gambling” has taken on fresh weight as a widely tracked market gauge, built from Federal Reserve data on the total market value of corporate equities relative to GDP, hovers near levels last seen during the dot-com bubble. The ratio, sometimes called the Buffett Indicator, draws on the Fed’s Z.1 Financial Accounts to compare the aggregate price tag of U.S. equities against the economy’s output, and its current elevation raises pointed questions about whether stock prices have stretched beyond what earnings and growth can support.
Why the Z.1 equity-to-GDP ratio demands attention now
The core tension is straightforward: when the market value of all U.S. corporate equities climbs far above GDP, buyers are paying more for each dollar of economic activity. That gap widened dramatically before the 2000 crash, and the same data series now shows a comparable stretch. The Federal Reserve’s financial accounts provide the underlying numbers, tracking the market value of equities outstanding across all sectors as part of the broader Financial Accounts of the United States.
A practical question follows from the data: does a persistently high ratio change corporate behavior? One testable idea is that when the market-value-to-GDP ratio stays elevated for several consecutive quarters, companies pull back on issuing new equity because the market’s appetite shifts from long-term investment toward short-term trading. If prices are driven more by speculation than by fundamental demand for capital, firms may find it harder to justify diluting shareholders at levels they suspect are unsustainable. Investors watching for that signal should track net equity issuance by non-financial corporations in the quarters ahead, though the Z.1 data itself does not publish a direct measure of speculative versus value-oriented holdings.
Another implication is portfolio-level. When the ratio is high, long-term investors must decide whether to accept lower prospective returns, raise cash, or tilt toward assets less tightly linked to broad equity valuations. None of those choices are easy when benchmark indexes continue to set new highs, but the valuation backdrop means that gains increasingly rely on continued optimism rather than expanding profits.
Federal Reserve data behind the dot-com comparison
The comparison to the late 1990s rests on a specific data trail. The Board of Governors of the Federal Reserve System publishes the Z.1 Financial Accounts, which include a series reporting the market value of corporate equities across all sectors. That series, available through the Federal Reserve Bank of St. Louis as the BOGZ1LM893064105A dataset, is sourced directly from the Fed’s own balance-sheet data and allows researchers to download, chart, and compare equity valuations across decades.
The Fed also publishes technical documentation explaining how the equity market value figures are constructed and what gets revised in subsequent releases. Those methodology notes clarify which components are estimated, how revisions flow through the data, and what users should know before drawing historical comparisons. This matters because any claim that the ratio is “near its dot-com high” depends on consistent measurement across a quarter-century of data. The technical notes confirm the series construction rules that make such comparisons defensible, though they do not specify a single threshold at which the ratio becomes dangerous.
Buffett’s remarks align with what the numbers show: equity prices have grown faster than the economy for an extended period. His framing, that the market environment rewards gambling over careful valuation, captures a dynamic the data can quantify but not fully explain. The Z.1 series documents the scale of the run-up, but it cannot distinguish between rational expectations of future innovation and simple speculative momentum. That interpretive gap is where investors must exercise judgment.
Limits and uses of the Buffett Indicator
Despite its simplicity, the equity-to-GDP ratio is not a market-timing tool. History shows that valuations can remain stretched for years, and investors who exit solely because the ratio is high may miss substantial further gains. GDP also excludes some drivers of corporate value, such as intangible assets and global revenue streams, which can weaken the link between domestic output and stock prices.
Still, the indicator serves as a blunt but useful risk gauge. When the market value of equities towers over the size of the economy, future returns tend to be lower and drawdowns more severe when sentiment turns. For corporate finance teams, that backdrop can influence decisions about buybacks, capital spending, and balance-sheet leverage. For households, it can inform how aggressively to allocate savings toward equities versus safer assets as retirement approaches.
What the current readings most clearly signal is not an imminent crash but an environment in which expectations are already rich. With valuations priced for continued strength, any disappointment in earnings, growth, or policy can have an outsized impact on prices. Buffett’s warning about “gambling” is, in that sense, less a forecast than a reminder: when the market’s total price tag strains against the scale of the underlying economy, the margin for error narrows, and the distinction between investing and speculation becomes harder to ignore.
Free for readers: The free Retirement Shield newsletter sends plain-English help keeping more of your money in retirement — the scams to dodge, the benefits you’re owed, and what’s changing with Social Security and Medicare, a couple times a week. Get the free newsletter.