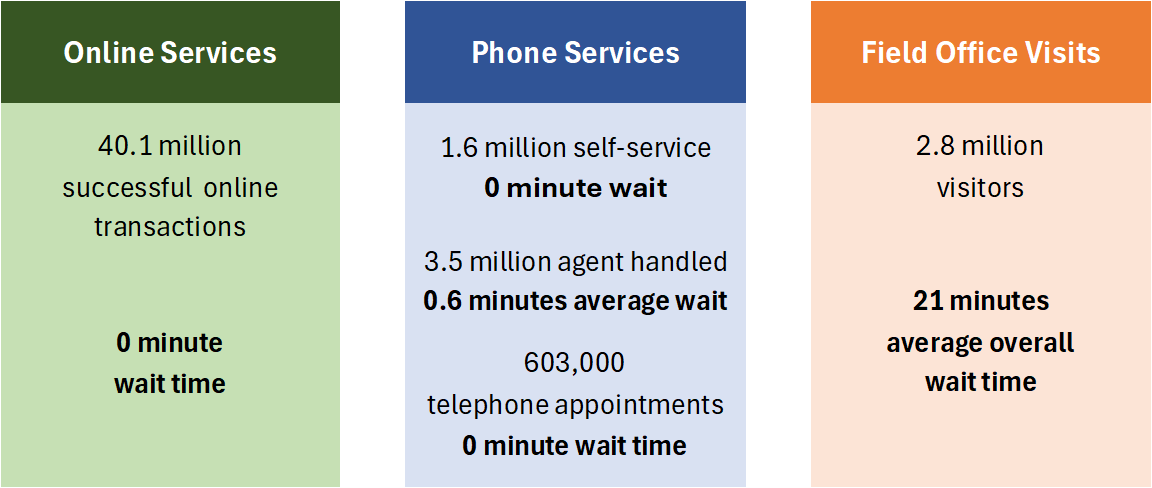
The Social Security Administration says nearly 25 million people visited one of its field offices during the current fiscal year, and that the average combined wait time for those visits has fallen to just under 21 minutes. The figure comes from SecurityStat, the agency’s own performance dashboard, which SSA uses to track and publish its customer-service goals. Because the number is self-reported and covers a fiscal year that has not yet ended, it is worth reading closely before treating it as a final verdict on how well the agency is serving retirees and disabled workers trying to get a claim resolved.
The Field-Office Number, By SSA’s Own Count
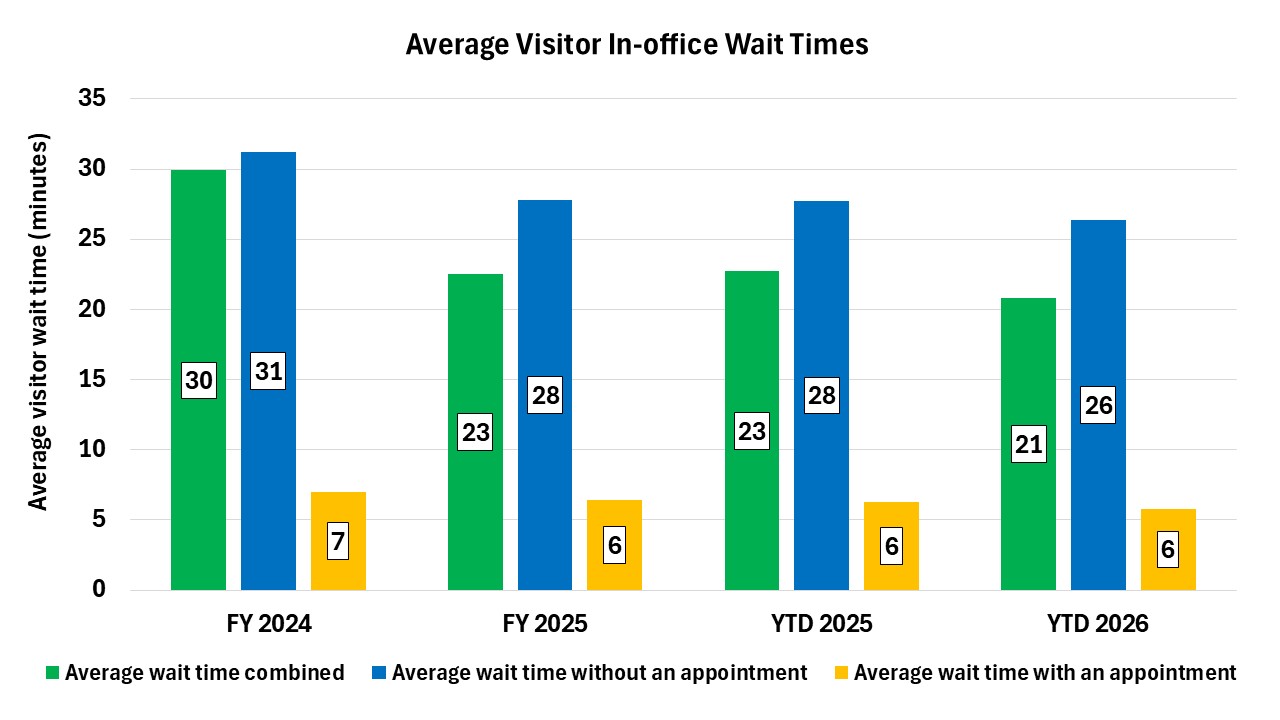
SSA’s fiscal year runs from October 1 through September 30, so the fiscal year 2026 figures on the agency’s performance page are year-to-date through July, not a closed annual tally. Fiscal 2024 ended with an average combined field-office wait of about 30 minutes; the agency’s FY2026 year-to-date average has fallen roughly 30 percent from that mark, to just under 21 minutes, across nearly 25 million field-office visitors so far this fiscal year.
The improvement is not evenly split. Visitors who scheduled an appointment waited about six minutes on average this fiscal year, while those who walked in without one waited closer to 26 minutes, according to the wait-time chart SSA publishes on its performance page. That same page steers visitors toward its online appointment scheduler, arguing that relatively few Social Security transactions actually require a trip to an office at all.
SSA credits faster contact times with measurable time savings for the public. Compared with July 2025, the agency estimates shorter waits saved the public 18.1 million hours through July 2026 across all its service channels, split roughly 10.7 million hours from online transactions, 5.6 million hours from National 800 Number calls, and 1.8 million hours for people who called or visited a field office, according to the service-channel snapshot the agency publishes alongside its narrative summary.
Free retirement updates: Enrollment and claim windows come and go, and missing one can cost real money. The free Retirement Shield newsletter keeps readers ahead of the deadlines that matter. Sign up free.
National 800 Number: From an 8-Minute Wait to 36 Seconds
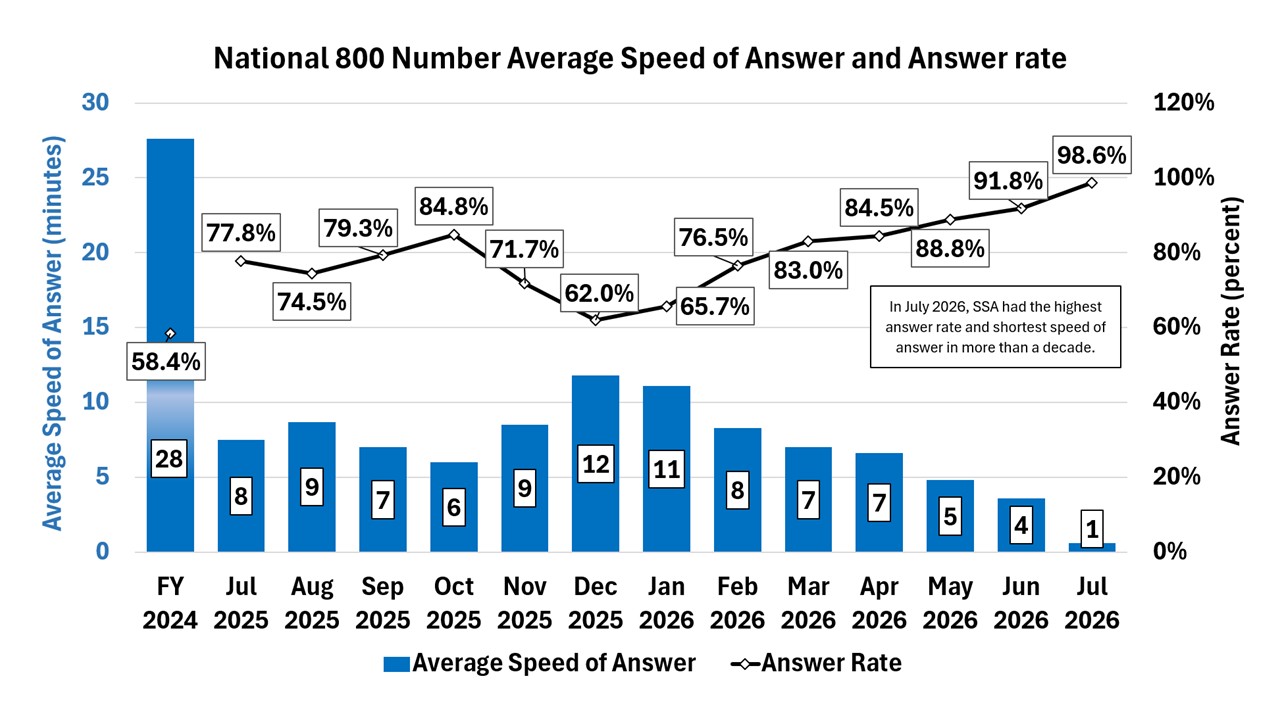
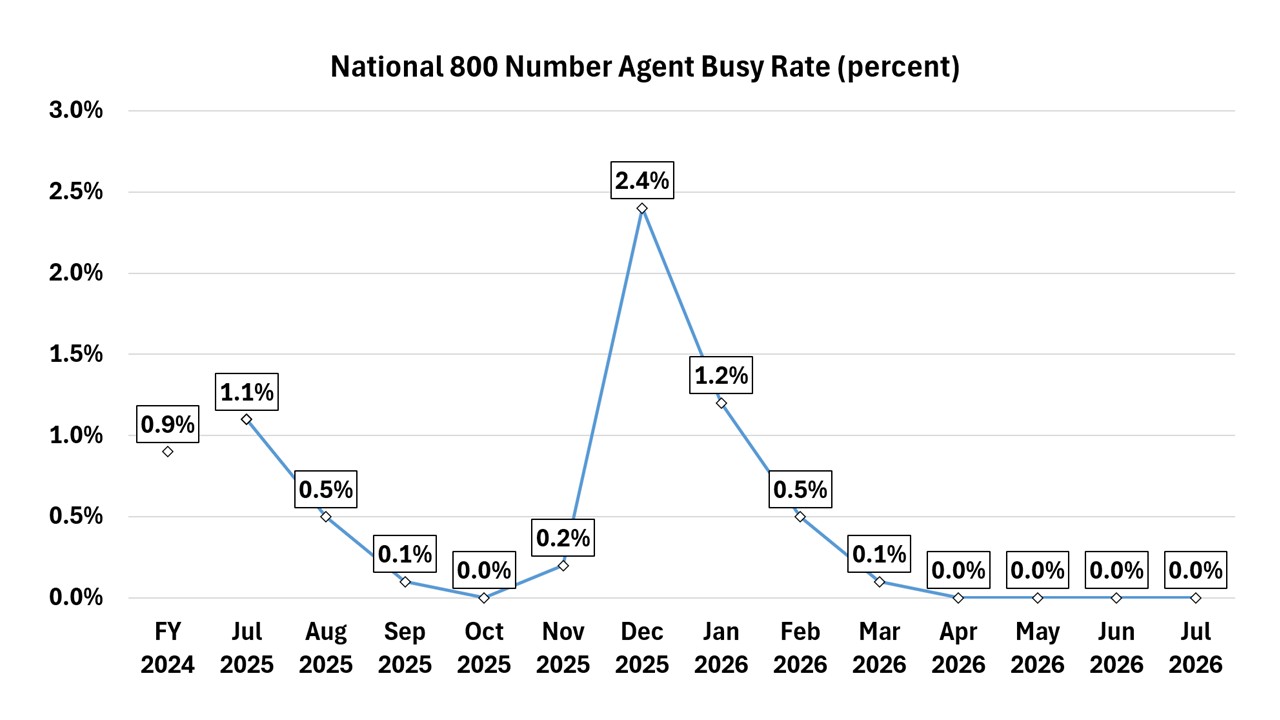
SSA’s telephone metrics show a steeper swing. The agency reports the National 800 Number averaged an 8-minute speed of answer with a 78 percent answer rate in July 2025; by July 2026, the average speed of answer had dropped to 0.6 minutes, or roughly 36 seconds, with an answer rate near 99 percent, according to the phone speed-of-answer chart on the same page. SSA also reports its agent busy rate, the share of calls that hit a signal because every agent was occupied, has fallen to as low as zero percent since February 2026, which the agency says let 20.8 million callers who needed an agent actually reach one, per its busy-rate chart.
An Independent Audit Backs the Phone Numbers, For One Fiscal Year
The phone figures have at least one outside check that the field-office and disability numbers do not. SSA’s Office of the Inspector General audited the National 800 Number’s publicly reported metrics, and the agency announced in a December 22, 2025 release that the OIG concluded SSA’s published telephone figures for fiscal year 2025 were accurate and that phone service genuinely improved that year, with average wait falling from 30 minutes in January 2025 to seven minutes by September 2025 while the agency handled 65 percent more calls than the year before. That audit covers FY2025 phone service specifically. It does not independently verify the newer FY2026 field-office wait time, or the disability and hearings figures below, all of which remain agency self-reported.
Retirement and Survivor Claims: Faster Contact, Slightly Less Timely Decisions
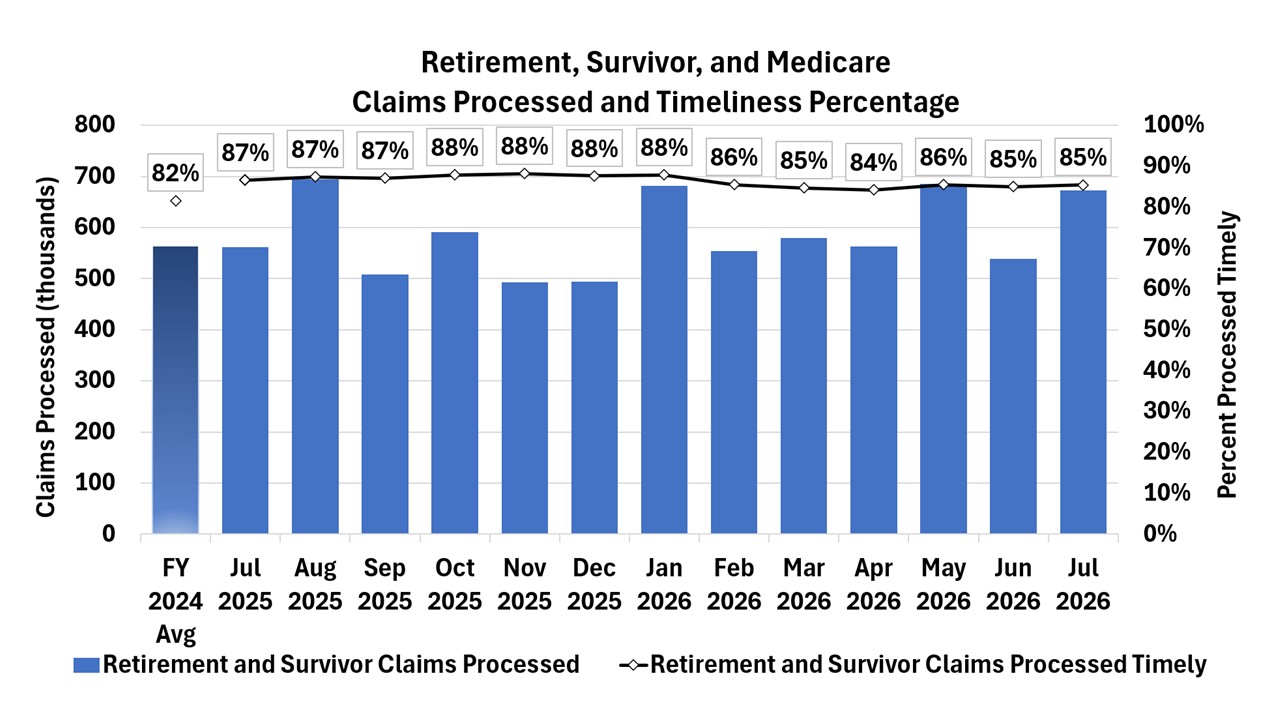
Field-office wait times and phone hold times measure how long it takes to reach someone at SSA, not how long it takes to actually get a claim decided. SSA’s performance page says most retirement, survivor, and Medicare claims are processed within 14 days when a benefit is due immediately or is about to start. But the share of those claims processed inside that timely window slipped from 87 percent in July 2025 to 85 percent in July 2026, according to the agency’s own claims-timeliness chart — a modest decline even as the front-door contact numbers improved. For a retiree or a survivor counting on a first check, that distinction matters more than how long the phone call or office visit took: a benefit that starts on time closes a gap in monthly income, while one that slips past the agency’s own 14-day window does not.
The Disability Backlog Behind the Headline Number
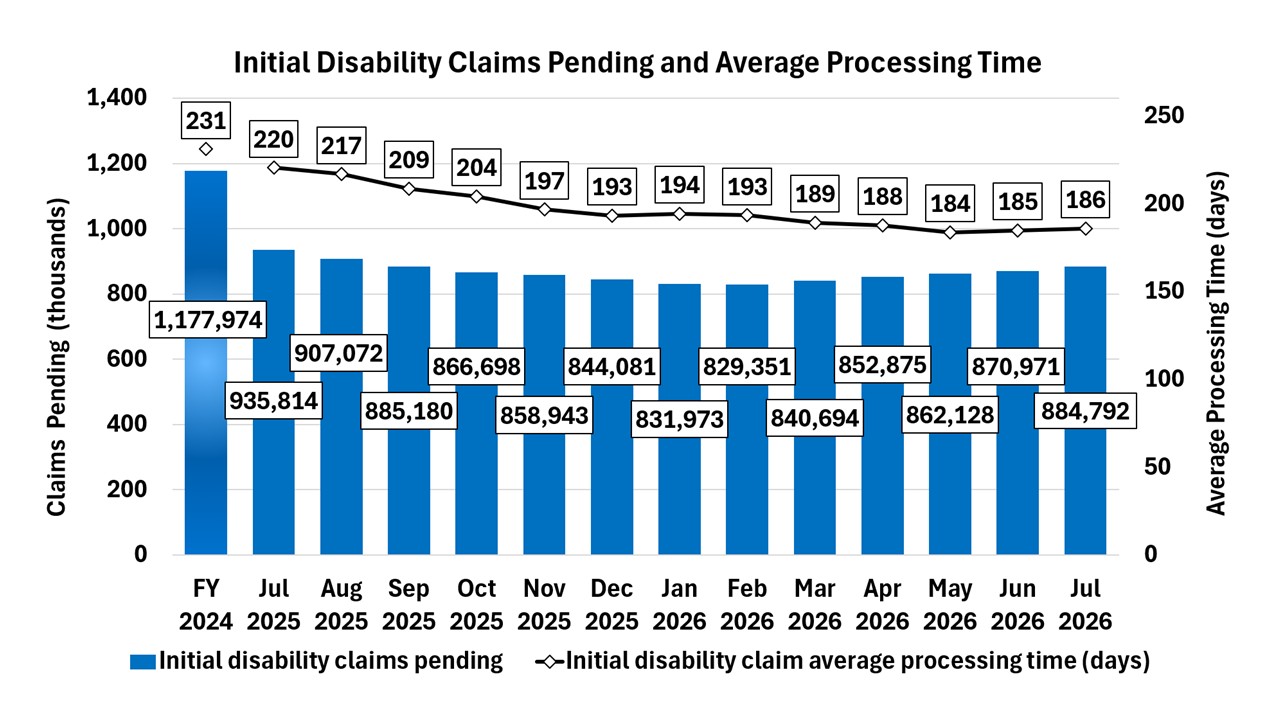
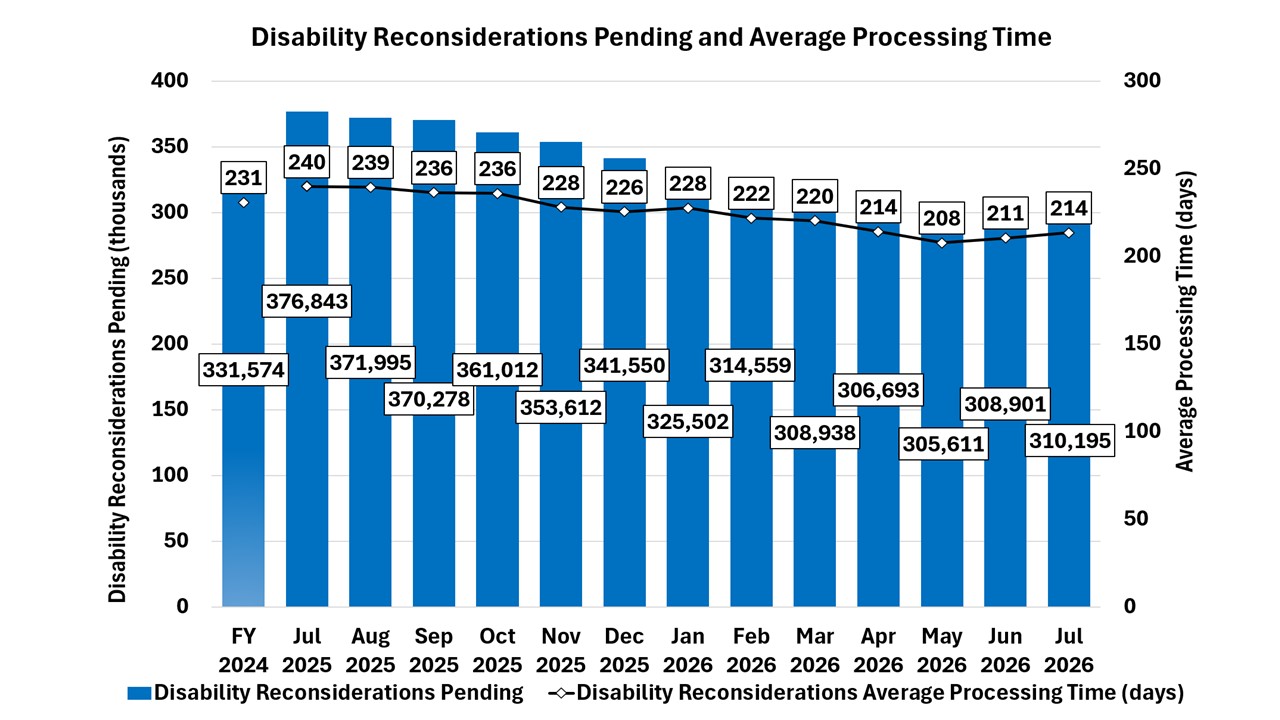
The clearer money story for many older and disabled applicants sits in SSA’s disability-determination data. The agency reports initial disability decisions now take an average of 186 days, 34 days faster than the 220-day average in July 2025, with pending initial claims easing from about 935,000 to about 885,000 over the same stretch, according to its initial-claims processing chart. Reconsideration cases, the next step for applicants who are denied and appeal, moved similarly: average processing time fell from 240 days to 214 days, and the pending caseload dropped from roughly 376,000 to about 310,000, per its reconsideration chart. That trend lines up with the broader claim SSA made in the same December 2025 release cited above: a 33 percent cut in the initial-claims backlog from an all-time high of 1.26 million pending cases in June 2024. For an applicant with no other income while a claim is under review, the 34-day improvement is real money: it is roughly a month less time spent waiting on a first disability check.
Hearings: Faster Per Case, But the Line Is Getting Longer
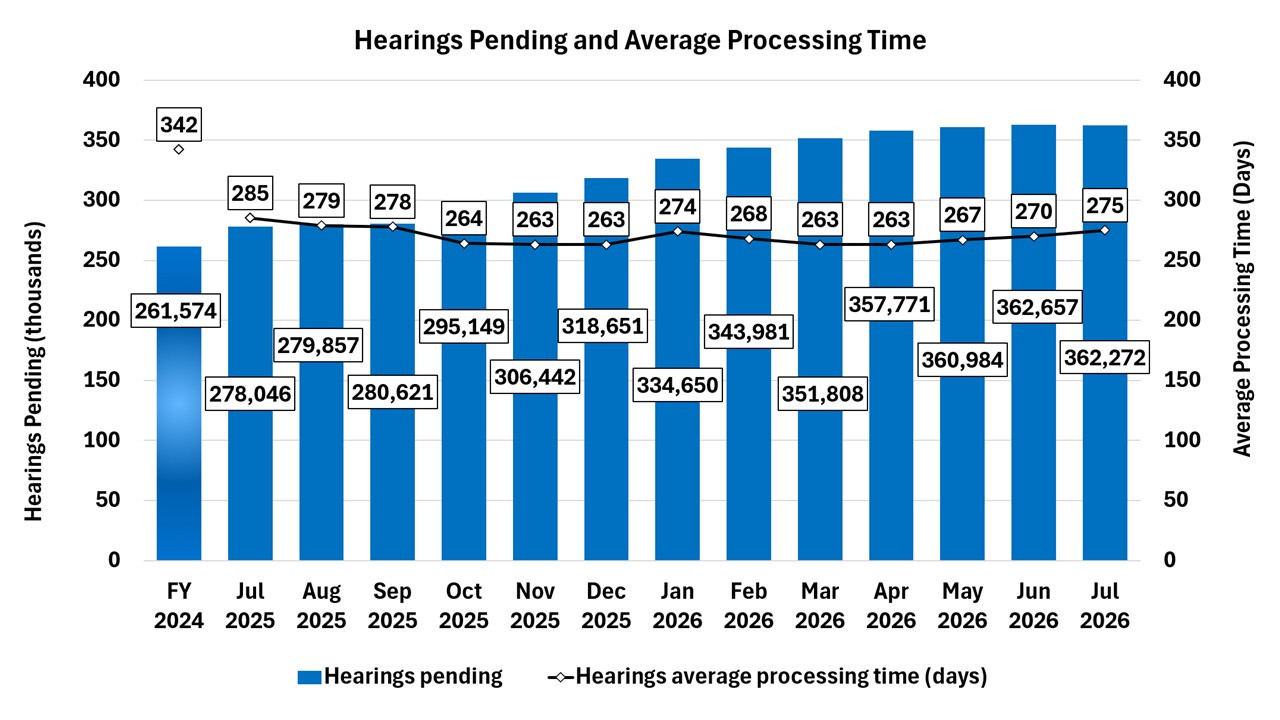
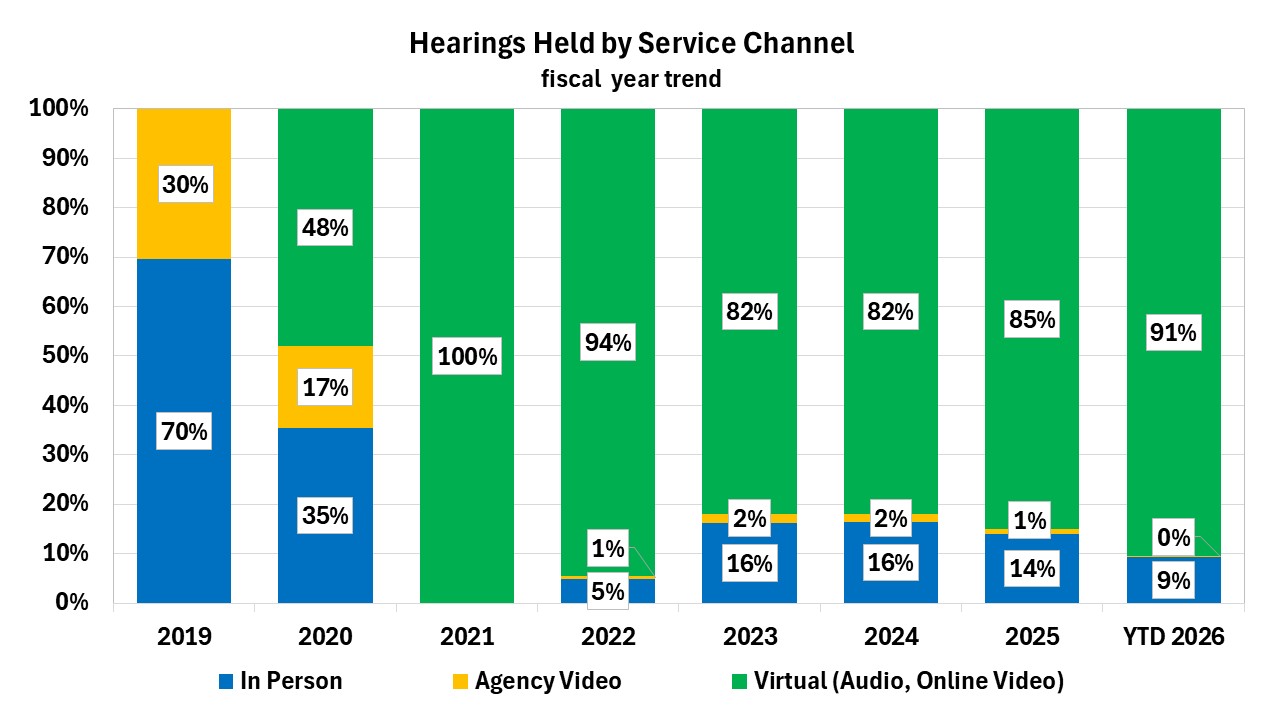
Hearings show the sharpest split between speed and volume. SSA says it is issuing hearing decisions about 10 days faster than a year earlier, with average processing time dropping from 285 days in July 2025 to 275 days in July 2026 — still short of the agency’s own 270-day target, according to its hearings processing-time chart. Yet the number of hearings pending grew over the same stretch, from about 278,000 to roughly 362,000, an increase of some 84,000 cases even as each individual case moved a little faster. SSA also reports that claimants increasingly choose virtual hearings, with about 91 percent held by phone or online video so far this fiscal year, up from 85 percent in FY2025, according to its hearings-format chart — a shift the agency credits in part for the modest per-case speed gains, even as the overall hearings queue keeps growing.
This article was produced with the assistance of AI and reviewed by The Financial Wire editorial team.
More Financial Reading
- How many CDs can you park at 1 bank? FDIC rules you must know
- The ideal retirement withdrawal rate so your savings actually last