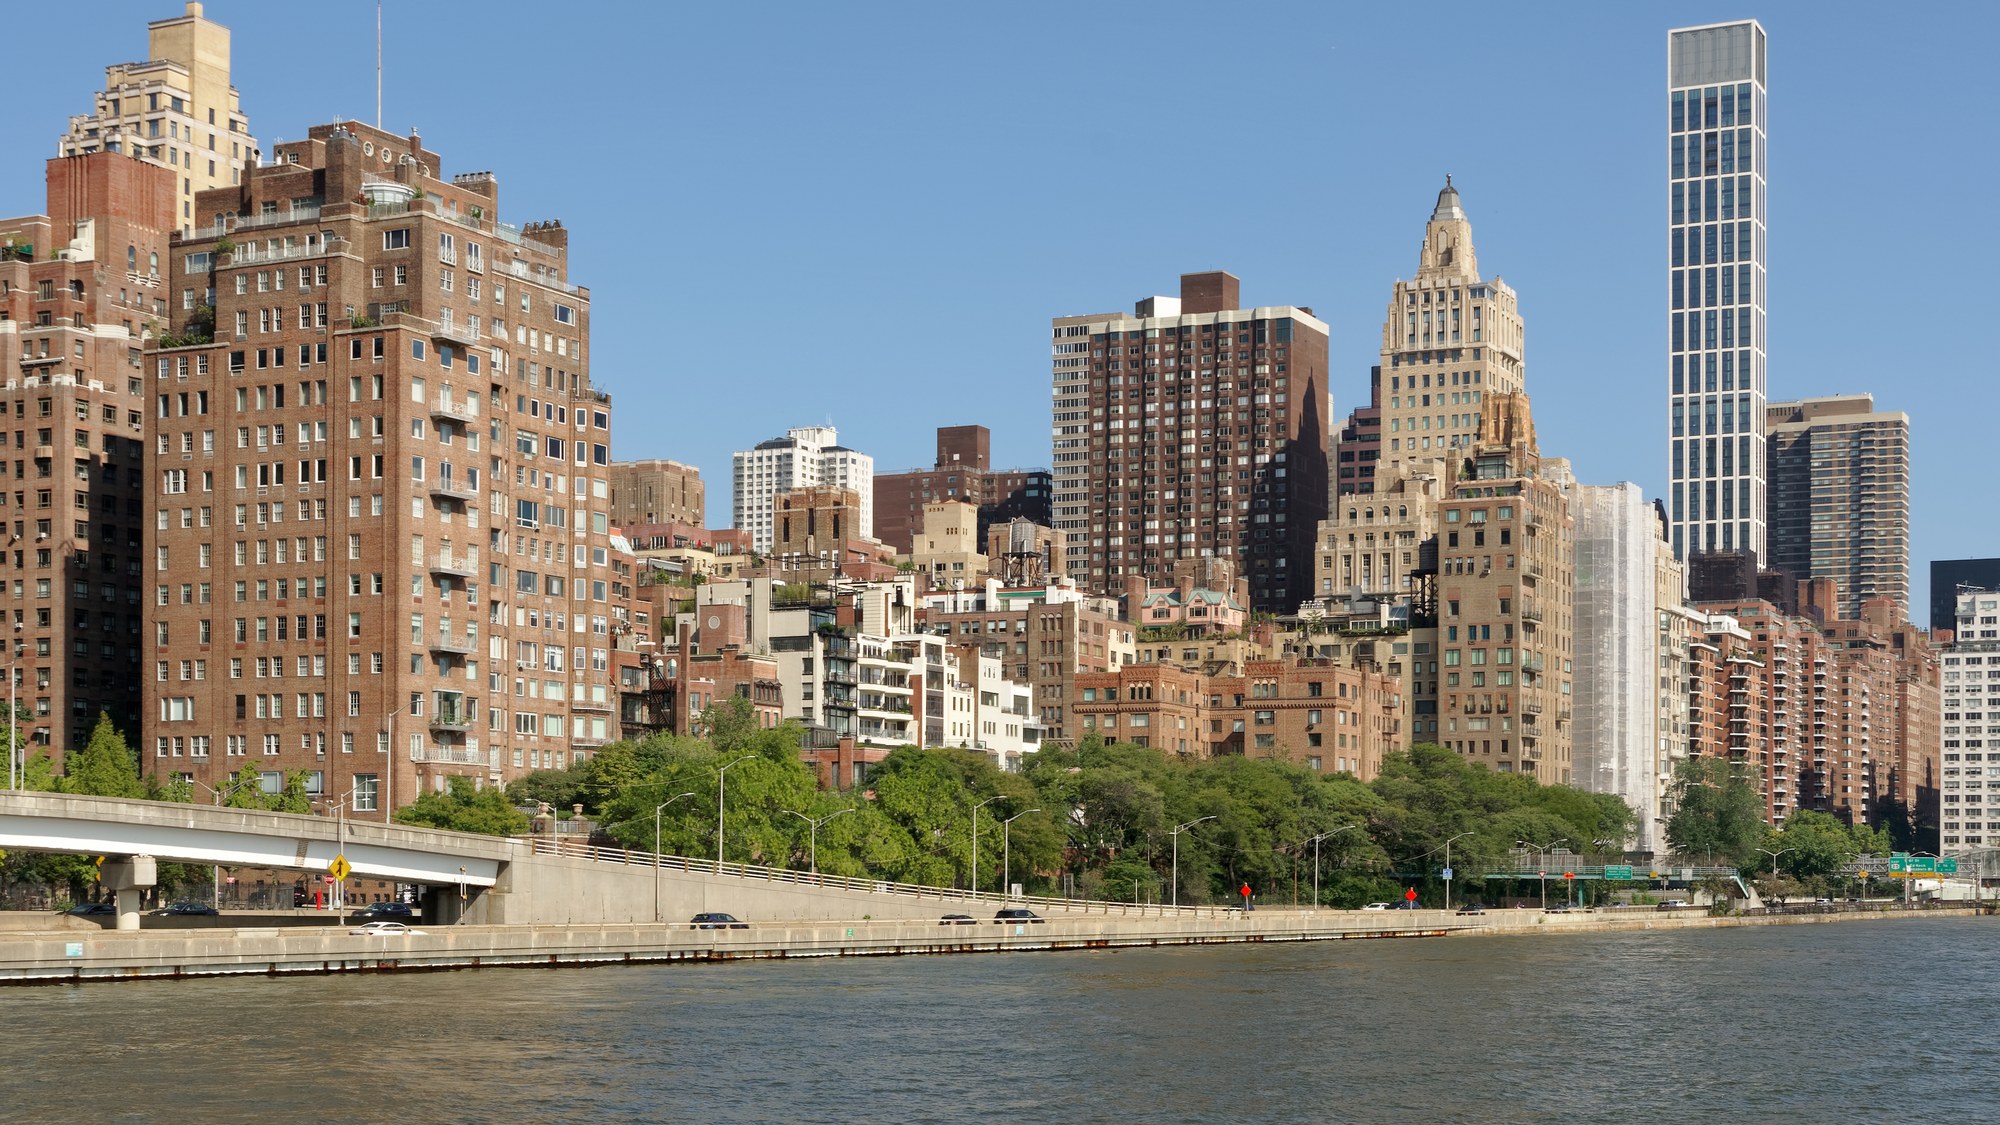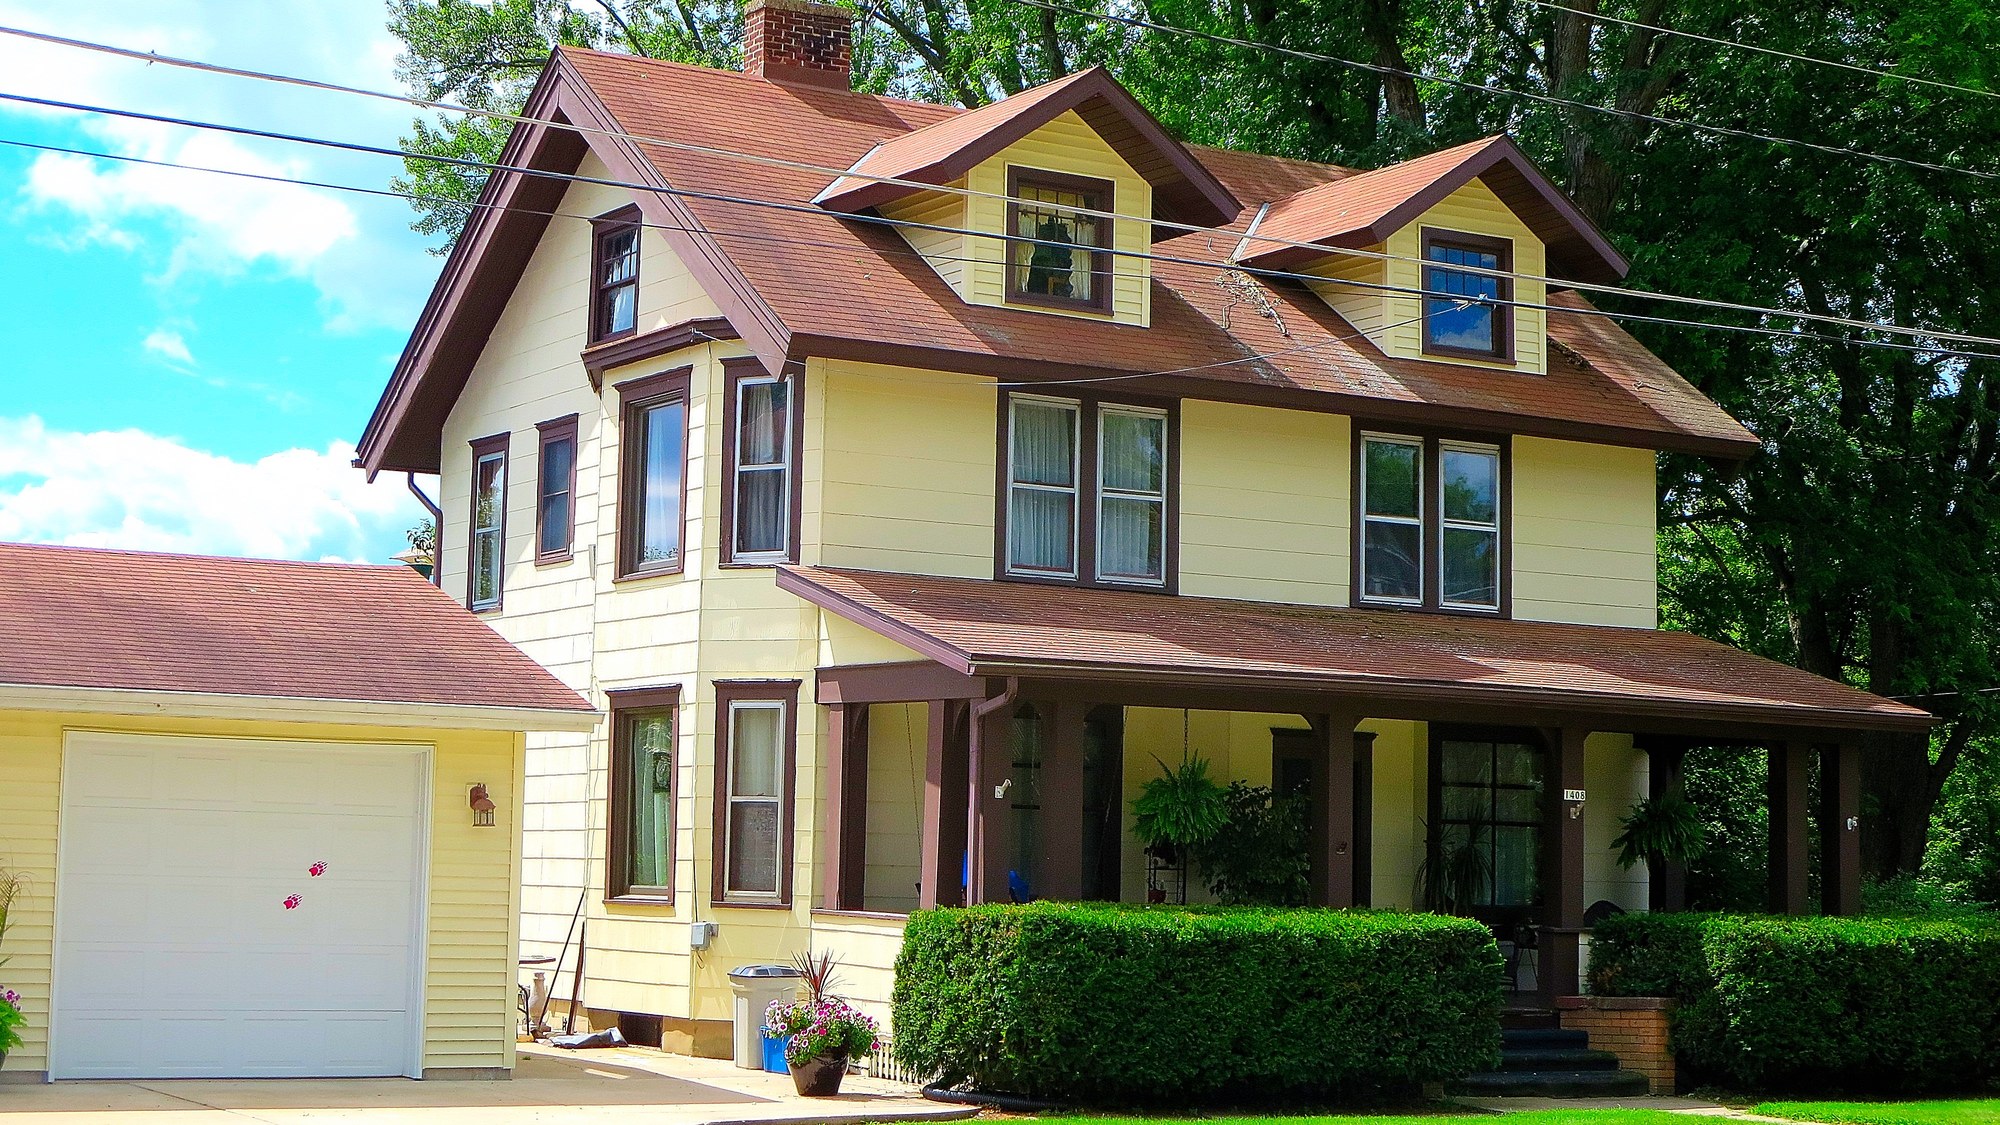
The typical asking rent for a single-family home reached $2,289 a month in August, up 3% from a year earlier, Zillow reported in its August rent report released September 16. That compares with a typical multifamily rent of $1,774, up a smaller 1.9% over the same period. Zillow also found that a renter now needs $77,919 in annual income to comfortably afford the typical U.S. rent, up 2.6% from a year earlier.
Inside the kit for a renter: The circuit-breaker credit that includes renters, plus an application log and renewal calendar, in The Senior Property Tax & Home-Cost Relief Kit. Look up the renter-eligible circuit-breaker credit and filing calendar →
How Much Single-Family Rents Actually Rose
Zillow’s August 2026 rent report put the typical asking rent for a single-family home at $2,289, up 3% from a year earlier, a faster pace than the 1.9% increase Zillow recorded for multifamily rentals, which averaged $1,774 in the same month. The gap between the two rental types, now $515 a month, has been a persistent feature of Zillow’s data through 2026, reflecting steadier demand for standalone houses even as apartment construction has added more multifamily supply in many metros. The 3% single-family growth rate is also faster than the 2.5% overall rent growth Zillow reported for the market as a whole, meaning single-family rentals are outpacing the broader rental market rather than simply tracking it, per the report.
What’s Keeping Single-Family Rent Growth Higher
Single-family rentals have drawn sustained demand from renters seeking more space, particularly families and downsizing older households who want a house without the costs of buying one, even as a wave of recent apartment construction has kept multifamily rent growth comparatively subdued. Zillow’s own national rent-versus-buy comparison in the same report, a typical buyer’s monthly payment of $3,014 against a typical rent of $1,948, helps explain why: a household priced out of homeownership by current mortgage rates often looks to a single-family rental as the next-closest option, adding pressure to that segment specifically. Those mortgage rates are not abstract: the Mortgage Bankers Association put the 30-year fixed rate at 7.1% for the week ending September 25, the highest since 2024, according to its chart of the week, the specific figure behind Zillow’s higher buyer-payment estimate. The wider that national gap between the $3,014 typical buying cost and the $1,948 typical rent grows, the more renters with the means to consider either option are likely to land on a single-family rental instead of an apartment, since it more closely resembles the space and privacy of the house they can’t yet afford to buy.
The Income A Renter Needs Now
Zillow calculates that a household needs $77,919 in annual income to comfortably afford the nationwide typical rent, a figure that rose 2.6% over the past year, slightly outpacing the 2.5% rent growth Zillow recorded across all rental types combined, according to the rent report. For someone renting specifically at the single-family level, at $2,289 a month, the income threshold to stay within a standard affordability guideline would run higher still than the $77,919 average, since that figure blends the cheaper multifamily segment into the same calculation.
A Widening Gap Between What Rent And Income Do Each Year
The 2.6% rise in the income needed to afford rent outpaced the 2.5% overall rent growth Zillow measured for all rental types, a small but telling gap between the two figures in the same report. For a single-family renter facing 3% annual growth specifically, a pace outpacing both of those national figures, the gap between what a lease costs and what a household’s income actually does from year to year compounds faster still than the national averages alone suggest, since 3% compounding annually adds up to considerably more over a decade of renting than a single year’s percentage implies.
A Cost That Moves Independently Of A Landlord’s Rent
A rent increase is not the only housing cost climbing for a renter; property owners who set rents in a market like this one are themselves often passing along their own rising property taxes, insurance premiums and maintenance costs, expenses that move on a separate schedule from any single rent report. Zillow’s data captures what a renter pays each month, not what happens on the landlord’s side of that ledger, or what tools exist for managing those underlying costs. A single-family rental in particular often sits on a property tax bill assessed the same way an owner-occupied home would be, since most jurisdictions don’t distinguish between the two for assessment purposes, meaning the $2,289 monthly rent already reflects whatever that underlying tax bill has done in recent years, whether or not the renter ever sees the assessment itself.
What This Rent Level Means Beyond The Monthly Check
An older renter on a fixed income facing a $2,289 monthly bill for a single-family home, or the $1,774 multifamily alternative, is contending with a rent growing faster than the overall inflation many federal benefit adjustments are pegged to, according to Zillow’s own year-over-year figures. That gap between rent growth and income growth is the practical stake behind Zillow’s report: a 3% annual increase compounds every year a renter stays in place, regardless of whether that renter ever considers buying at all. A renter who has occupied the same single-family home for several years is likely to have absorbed multiple rounds of increases at or near that pace already, even if any single year’s 3% figure sounds modest in isolation, since each year’s increase applies on top of the prior year’s higher base rent rather than resetting against some fixed starting point.
The Renter’s Share Of A Rising Housing Bill
Zillow’s single-family rent figure describes what a tenant pays a landlord, but property owners who set that rate are themselves managing their own property-tax bills, insurance premiums and repair costs, expenses a renter never sees itemized but that still shape the 3% annual increase Zillow measured. A renter absorbing that increase is paying a share of those underlying costs even without owning the property outright.
The Senior Property Tax & Home-Cost Relief Kit explains the renter-inclusive circuit-breaker credit, the five kinds of property-tax relief available to owners, and where to find heating and cooling help.
Check the circuit-breaker credit built for renters in The Senior Property Tax & Home-Cost Relief Kit.
This article was produced with AI assistance and checked against the primary sources linked above.