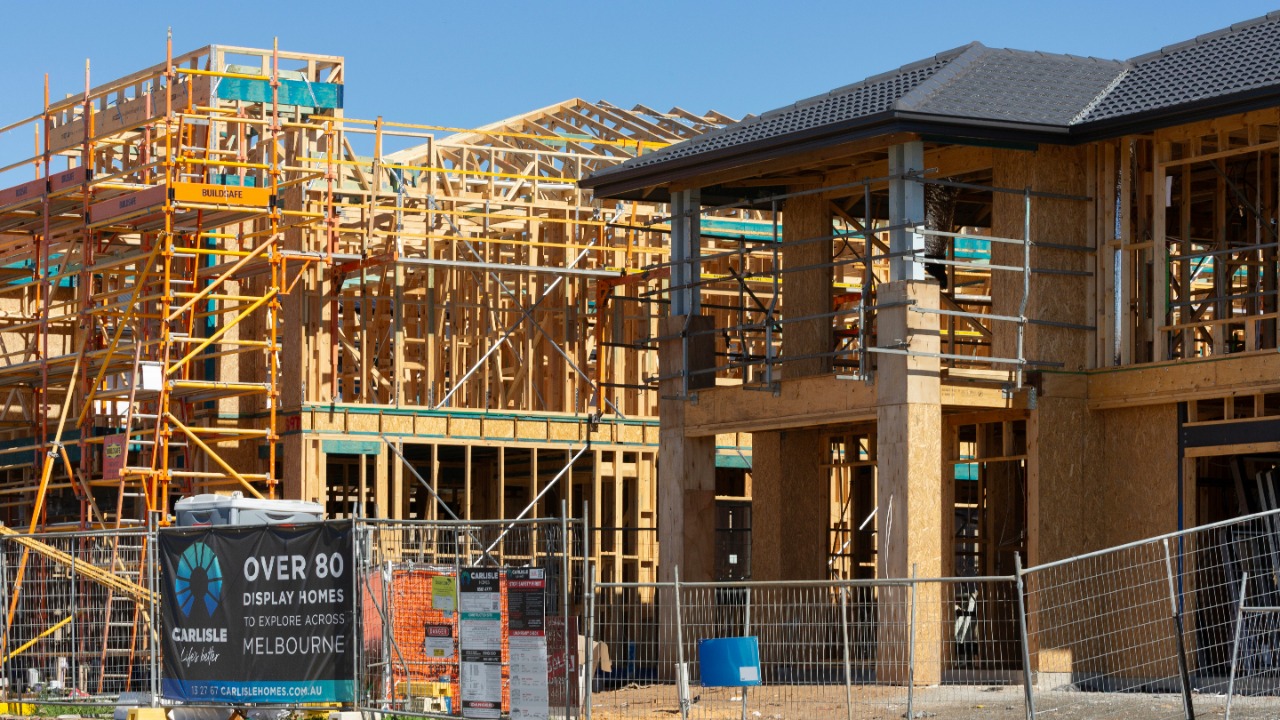
Building permits are the paperwork stage of construction, filed before a shovel ever touches the ground, which makes August’s numbers a look further into the future than the starts figures released the same day. The Census Bureau’s count shows fewer permits issued in August than in July, but meaningfully more than were issued in August of last year, a combination that reads differently depending on whether the comparison is to last month or last year. For households watching whether new supply, and the property values and tax assessments that come with it, keeps building in their area, permits are the earlier signal.
Permits Fell 2.7% On The Month But Rose 3.5% Over The Year
Privately owned housing units authorized by building permits ran at a seasonally adjusted annual rate of 1,394,000 in August, down 2.7% from July’s revised rate but up 3.5% from August 2025, according to the Census Bureau and HUD’s joint New Residential Construction report, released September 17. Because a permit is filed before construction begins, the report is typically read as a leading indicator of building activity several months out, ahead of the starts and completions figures that follow later in the same release. A single month’s dip against a still-higher year-over-year baseline is the kind of mixed reading that keeps the two comparisons from telling the same story.
The filing puzzle a permit doesn’t solve: A permit count that ran 3.5% above last year is one input into how a county eventually reassesses a neighborhood, but pairing the right property-tax freeze or exemption with a specific county’s filing rules is a separate job the worksheets and application log inside the kit are built to organize. Match a filing rule to a county with The Senior Property Tax & Home-Cost Relief Kit.
Single-Family Permits Slipped While Multifamily Held Larger Share
Single-family permits fell 1.8% in August to an annual rate of 878,000, a smaller decline than the 2.7% drop in the total figure, while permits for buildings of five or more units came in at an annual rate of 467,000, per the same Census/HUD release. That split matters for anyone tracking what kind of new housing is actually in the pipeline: a market adding proportionally more multi-family permits is signaling more apartment and condo supply ahead relative to detached houses, even in a month when the headline permit total declined.
Why The Year-Over-Year Gain Is The More Durable Signal
Census attaches wider statistical noise to single-month changes than to year-over-year comparisons across a full 12-month span, which is one reason the 3.5% annual increase in permits is generally treated as a sturdier read on the underlying trend than the 2.7% monthly decline. A market where more permits were filed than a year earlier, even after a soft month, points toward more homes eventually breaking ground and reaching completion than the prior year’s pace implied, assuming permit-holders follow through and pull the corresponding building permits into actual construction starts.
What More Permitted Supply Can Mean For Local Property Values
New construction activity feeds directly into local property tax assessments, since county assessors periodically revalue neighborhoods based in part on recent building and sales activity nearby. A homeowner in an area where permitted construction is running above last year’s pace may see that reflected in a future reassessment notice, whether the change in assessed value moves a property tax bill up or, less often, down. Census’s report does not track individual assessments, but the permit count it publishes each month is one of the inputs that eventually shows up on a property tax notice months or years later.
Permits And Starts Tell Two Different Parts Of The Same Story
Read together with the same day’s starts figures, which showed total groundbreaking down 2.6% to a 1,275,000 pace, August’s permit data suggests builders pulled back on new project filings and actual construction at similar times, even as the year-over-year permit trend still points higher than 12 months ago. That combination, a soft month sitting inside a stronger annual trend, is the kind of reading Census’s own confidence intervals are built to caution against over-interpreting from a single release. A homeowner or prospective buyer tracking local building activity is better served by watching several months of permit data than reacting to any one month’s percentage change in isolation.
The same August release also reported housing completions, homes actually finished and ready for occupancy, at an annual rate of 1,128,000, down 11.9% from July and 27.1% from a year earlier, according to the Census/HUD report. That steep completions decline sits at the far end of the construction pipeline from August’s permit filings, which come first, and the gap between a permit count still running above last year’s pace and a completions count running sharply below it shows how much can change between when a project is authorized and when it is actually delivered to the market.
What The Permit-To-Completion Lag Means For A Home Search Today
Because months typically separate a filed permit from a finished home, a household counting on more new supply reaching the market soon should weigh the completions figure as heavily as the permit count: a rising permit trend signals more building activity is authorized, but August’s sharp drop in completions shows that authorized activity is not yet translating into homes ready to buy or rent. For an older household deciding between waiting for new construction and buying an existing home now, that lag is a practical reason the permit and completions numbers, both from the same Census release, need to be read together rather than in isolation.
Filing Season Still Comes Before The Ribbon Cutting
August’s building-permit count fell 2.7% from July but stood 3.5% above a year earlier, a signal about future construction that says nothing about the property-tax filing windows and exemption paperwork a current homeowner has to track, regardless of how much new building is permitted nearby.
The Senior Property Tax & Home-Cost Relief Kit lays out the circuit-breaker credit that includes renters and an application log and renewal calendar, giving a homeowner a way to track filing windows independent of the local permitting cycle.
Look up the renewal calendar and application log in The Senior Property Tax & Home-Cost Relief Kit.
This article was produced with AI assistance and checked against the primary sources linked above.