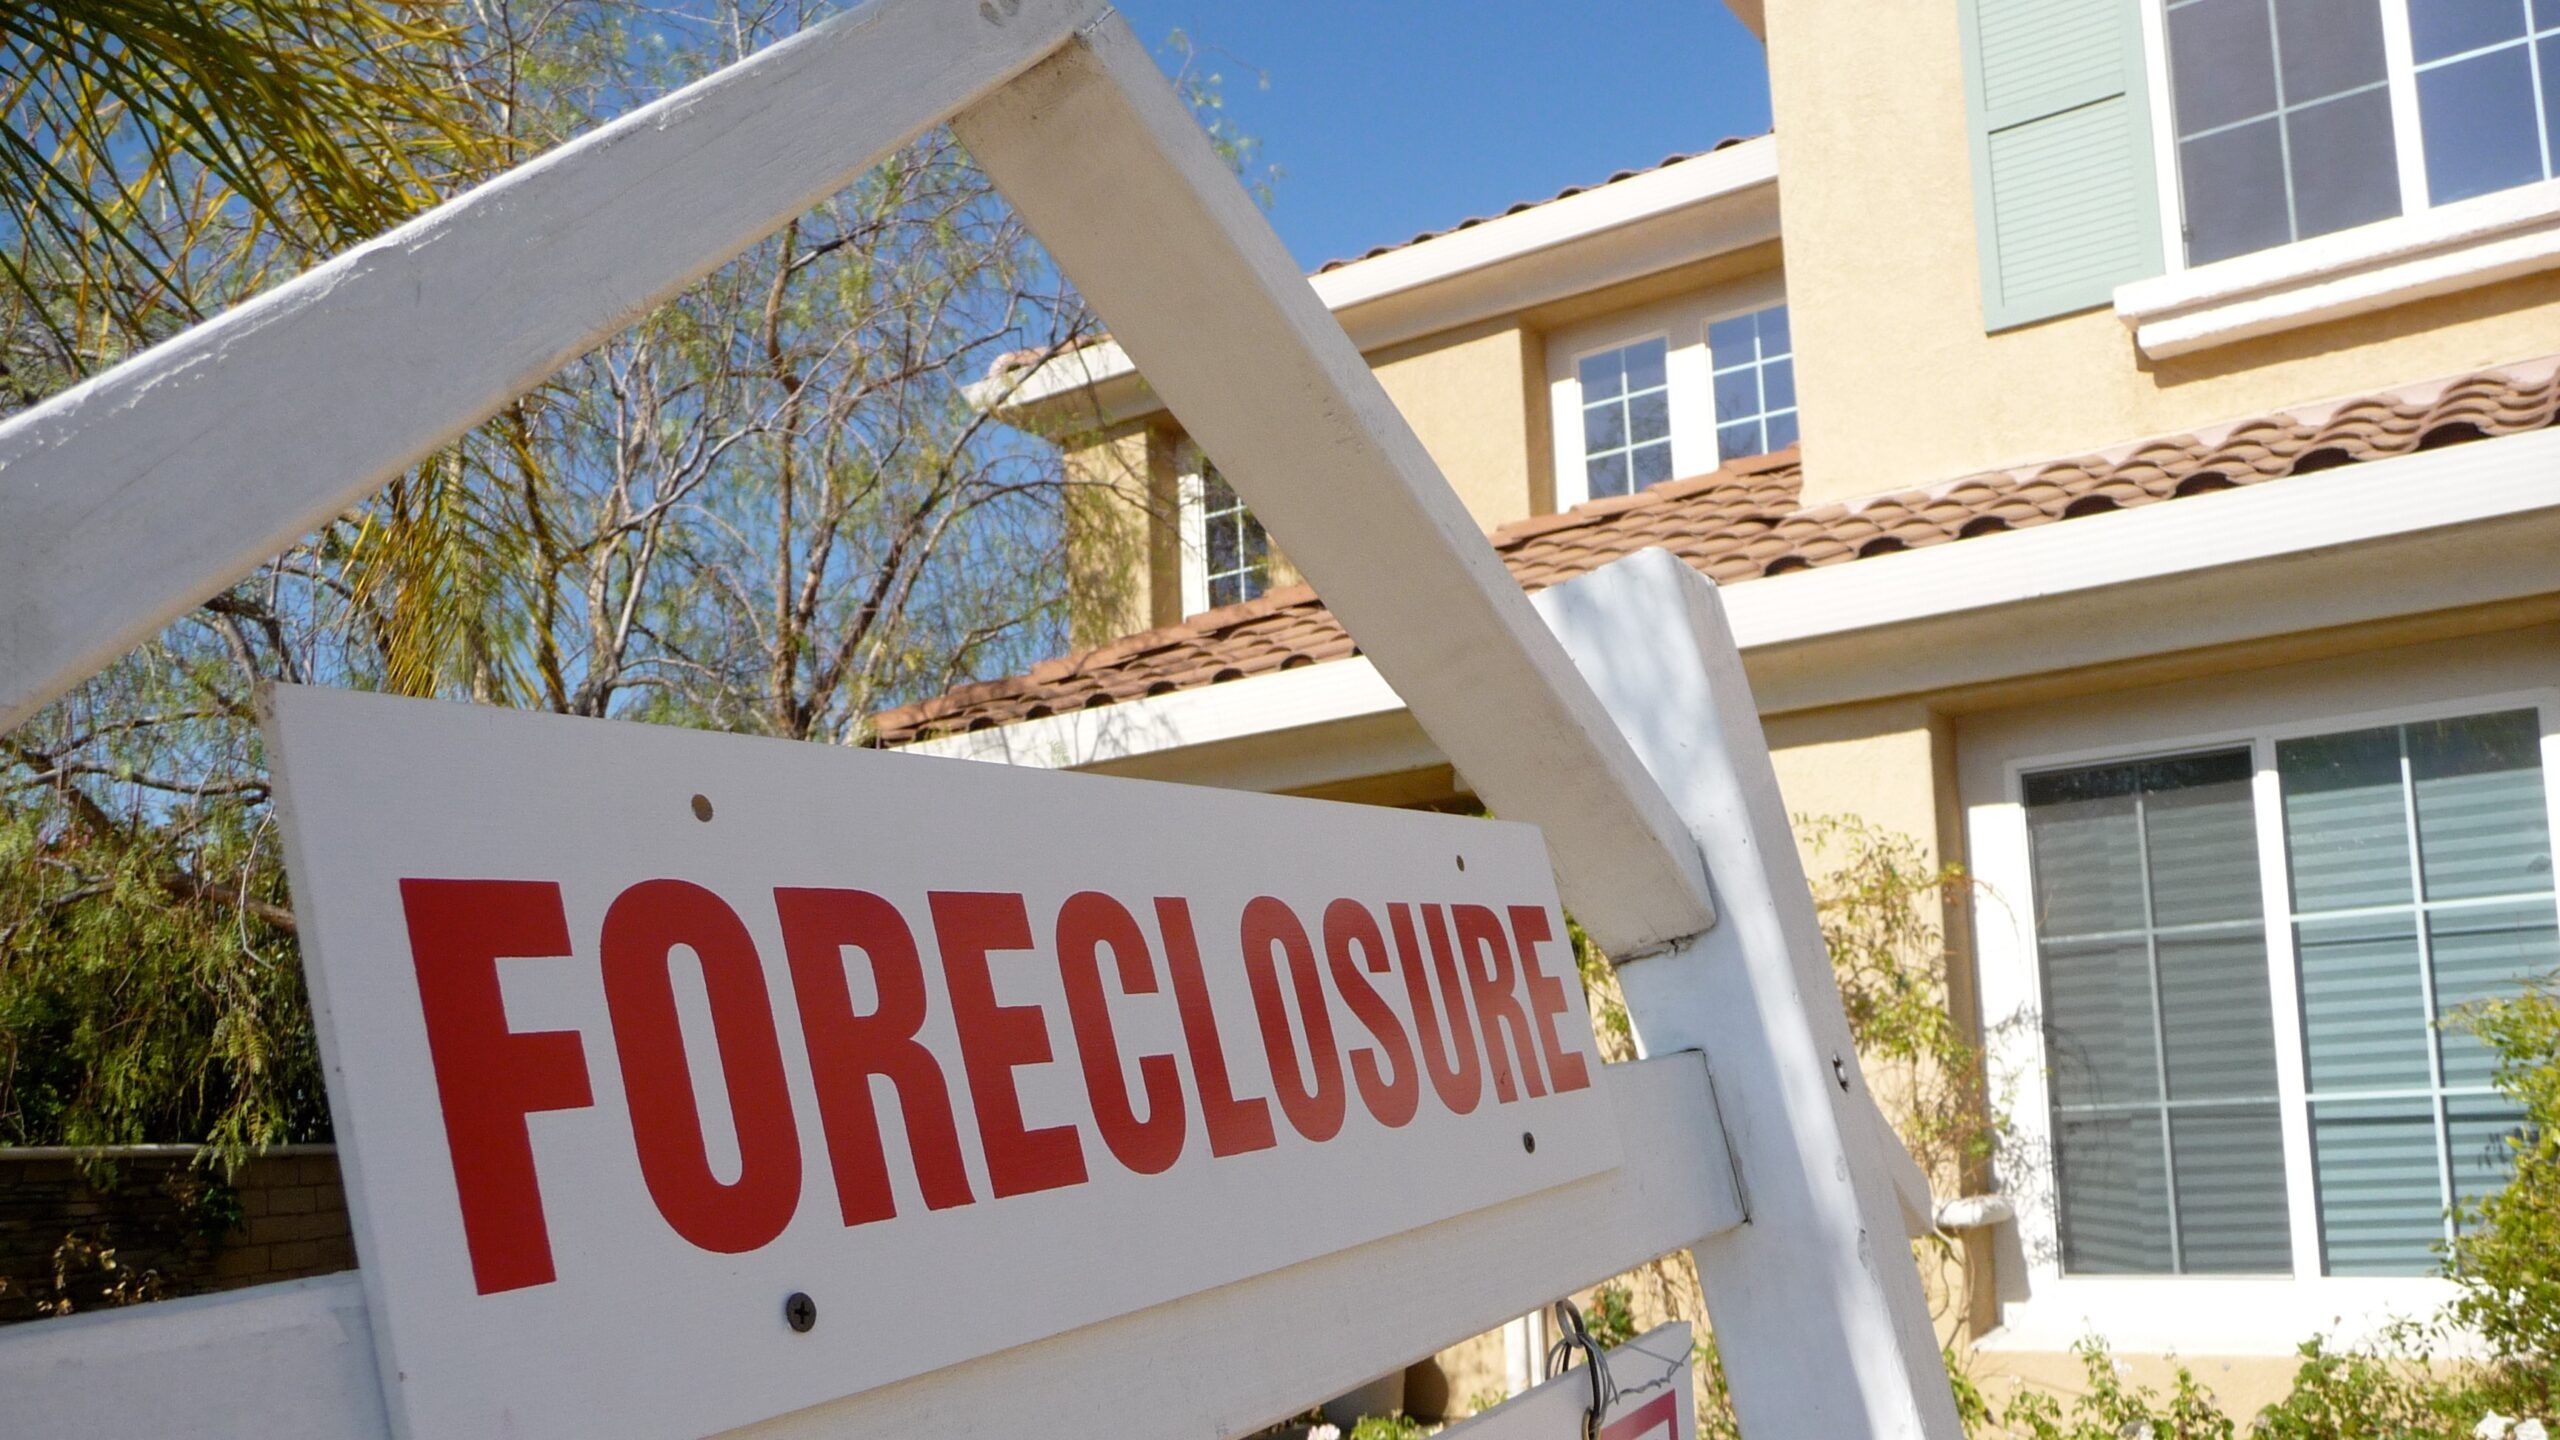
In 2009, roughly one in every 45 American households received a foreclosure notice. In 2024, that figure was closer to one in 370. The gap between those two numbers is the single most important thing to understand about today’s foreclosure headlines.
Foreclosure filings across the United States have climbed about 26% from the historic lows recorded during the pandemic, according to property-data firm ATTOM’s Year-End 2024 U.S. Foreclosure Market Report. That percentage sounds jarring. But the baseline it’s measured against was artificially suppressed by federal moratoriums, stimulus payments, and forbearance programs that kept millions of loans out of default proceedings for more than a year.
The real comparison point is the Great Recession. The Year-End 2009 Foreclosure Market Report, originally published by RealtyTrac and now archived in Yale’s Program on Financial Stability collection, documented 3,957,643 total filings on 2,824,674 properties in a single calendar year, producing a national foreclosure rate of 2.21%. By ATTOM’s tracking, the current rate sits near 0.27%, roughly one-eighth of that crisis peak.
Why filings are climbing now
The pandemic created an artificial floor. Between March 2020 and mid-2021, federal moratoriums froze most foreclosure proceedings. CARES Act forbearance programs let millions of borrowers pause payments without penalty. Stimulus checks and expanded unemployment benefits kept household budgets afloat. When those supports expired, a backlog of delinquent loans began moving through the legal pipeline, and filings started rising from a historically suppressed starting point.
A November 2024 research note from Federal Reserve staff examined the recent rise in consumer delinquency rates and concluded that the uptick reflects a post-pandemic adjustment, not a sudden collapse in household finances. Mortgage delinquency rates have edged higher, the Fed analysts found, but they remain below the averages observed outside of severe recessions. The note attributed shifting patterns to changes in consumer spending behavior and the expiration of pandemic-era relief rather than a fundamental deterioration in borrower health.
Rick Sharga, founder and CEO of CJ Patrick Company and a veteran foreclosure-market analyst, has been one of the most consistent voices framing the data this way. “What we’re really seeing is a normalization of foreclosure activity,” Sharga said in commentary accompanying ATTOM’s data releases, noting that current filing volumes are tracking back toward levels seen from 2017 through 2019, years widely considered healthy by historical standards.
What makes this cycle fundamentally different from 2009
The structural gap between today’s housing market and the one that collapsed in 2008 is enormous, and it shows up in nearly every metric that matters.
Lending standards are far tighter. The no-documentation, no-income-verification loans that fueled the mid-2000s bubble are effectively gone. Post-crisis regulations, including the Dodd-Frank Act’s Qualified Mortgage rules, require lenders to verify a borrower’s ability to repay. The result: today’s mortgage holders are, on average, significantly more creditworthy than the borrowers who entered the market between 2004 and 2007.
Homeowner equity is near record levels. The Federal Reserve’s Financial Accounts of the United States (Z.1) showed aggregate homeowner equity exceeding $35 trillion as of the third quarter of 2024. Years of rising home prices have given most borrowers a substantial equity cushion. During the last crisis, millions of homeowners were “underwater,” owing more than their properties were worth, which made walking away a rational financial decision. That dynamic is largely absent today. It also means many distressed borrowers in 2025 and 2026 can sell their homes at a profit rather than lose them to foreclosure, a relief valve that barely existed in 2009.
The labor market is holding. The national unemployment rate has remained near 4% through early 2026, according to Bureau of Labor Statistics releases. Job loss was the primary trigger for mortgage default during the Great Recession, when unemployment peaked above 10%. A functioning labor market gives most borrowers the income to keep making payments even as mortgage rates near 7% squeeze monthly budgets.
Regulators are in routine mode, not emergency mode. HUD’s repository of FHA Mortgagee Letters tells the story clearly. During the crisis years, federal agencies issued a rapid stream of directives ordering foreclosure moratoriums, mandatory loan modifications, and emergency servicing rules. Recent letters deal with routine servicing guidance, program adjustments, and clarifications of existing policy. The bureaucratic tone is calm because the system is not under threat.
Where the real pressure points are
National averages can mask genuine pain in specific places and among specific groups.
Borrowers who took out adjustable-rate mortgages or non-qualified (non-QM) loans during the ultra-low-rate window of 2020 and 2021 may face payment shocks as those loans reset to higher rates. First-time buyers who stretched to purchase at peak prices with minimal down payments have less equity to absorb even a modest price correction. And communities hit by localized economic disruptions, whether a factory closure, a natural disaster, or a sharp drop in a dominant industry, can experience foreclosure spikes that feel crisis-level even when the national picture is stable.
FHA-insured loans deserve particular attention. FHA serves a disproportionate share of first-time buyers and borrowers with lower credit scores, making its portfolio more sensitive to economic stress. Publicly available HUD data portals have not yet released granular FHA foreclosure-action statistics for the most recent filing periods, which limits the ability to assess whether government-backed loans are driving an outsized share of the increase. That data gap is worth watching.
ATTOM’s state-level data has shown elevated filing rates in parts of the Sun Belt and the industrial Midwest, though even those higher-rate states remain well below their own 2009 peaks. Tracking regional data over the next several quarters will be far more informative than fixating on the national percentage change.
What this actually means for homeowners
For the vast majority of mortgage holders, the rising foreclosure count is statistical noise, not a personal threat. Most borrowers locked in fixed rates below 5% during the pandemic refinancing boom and are sitting on significant equity. Their risk of foreclosure is minimal.
For borrowers who are struggling, the environment is far more forgiving than it was 17 years ago. Loss-mitigation options, including loan modifications, partial claims, and extended repayment plans, are more standardized and more accessible than they were during the crisis. HUD-approved housing counseling agencies offer free guidance, and servicers are generally required to evaluate borrowers for alternatives before initiating foreclosure proceedings.
The most reasonable read of the data, as of mid-2026, is cautious realism. A 26% increase in foreclosure filings is not trivial, and it warrants close monitoring, especially for vulnerable borrowers and regions where local conditions diverge sharply from national trends. But the scale of activity, the strength of household balance sheets, the tightness of lending standards, and the absence of emergency regulatory action all point in the same direction: the housing market is recalibrating after an extraordinary period of government support. It is not reliving 2009, and the numbers, in proper context, show exactly how wide that gap remains.

Vince Coyner is a serial entrepreneur with an MBA from Florida State. Business, finance and entrepreneurship have never been far from his mind, from starting a financial education program for middle and high school students twenty years ago to writing about American business titans more recently. Beyond business he writes about politics, culture and history.