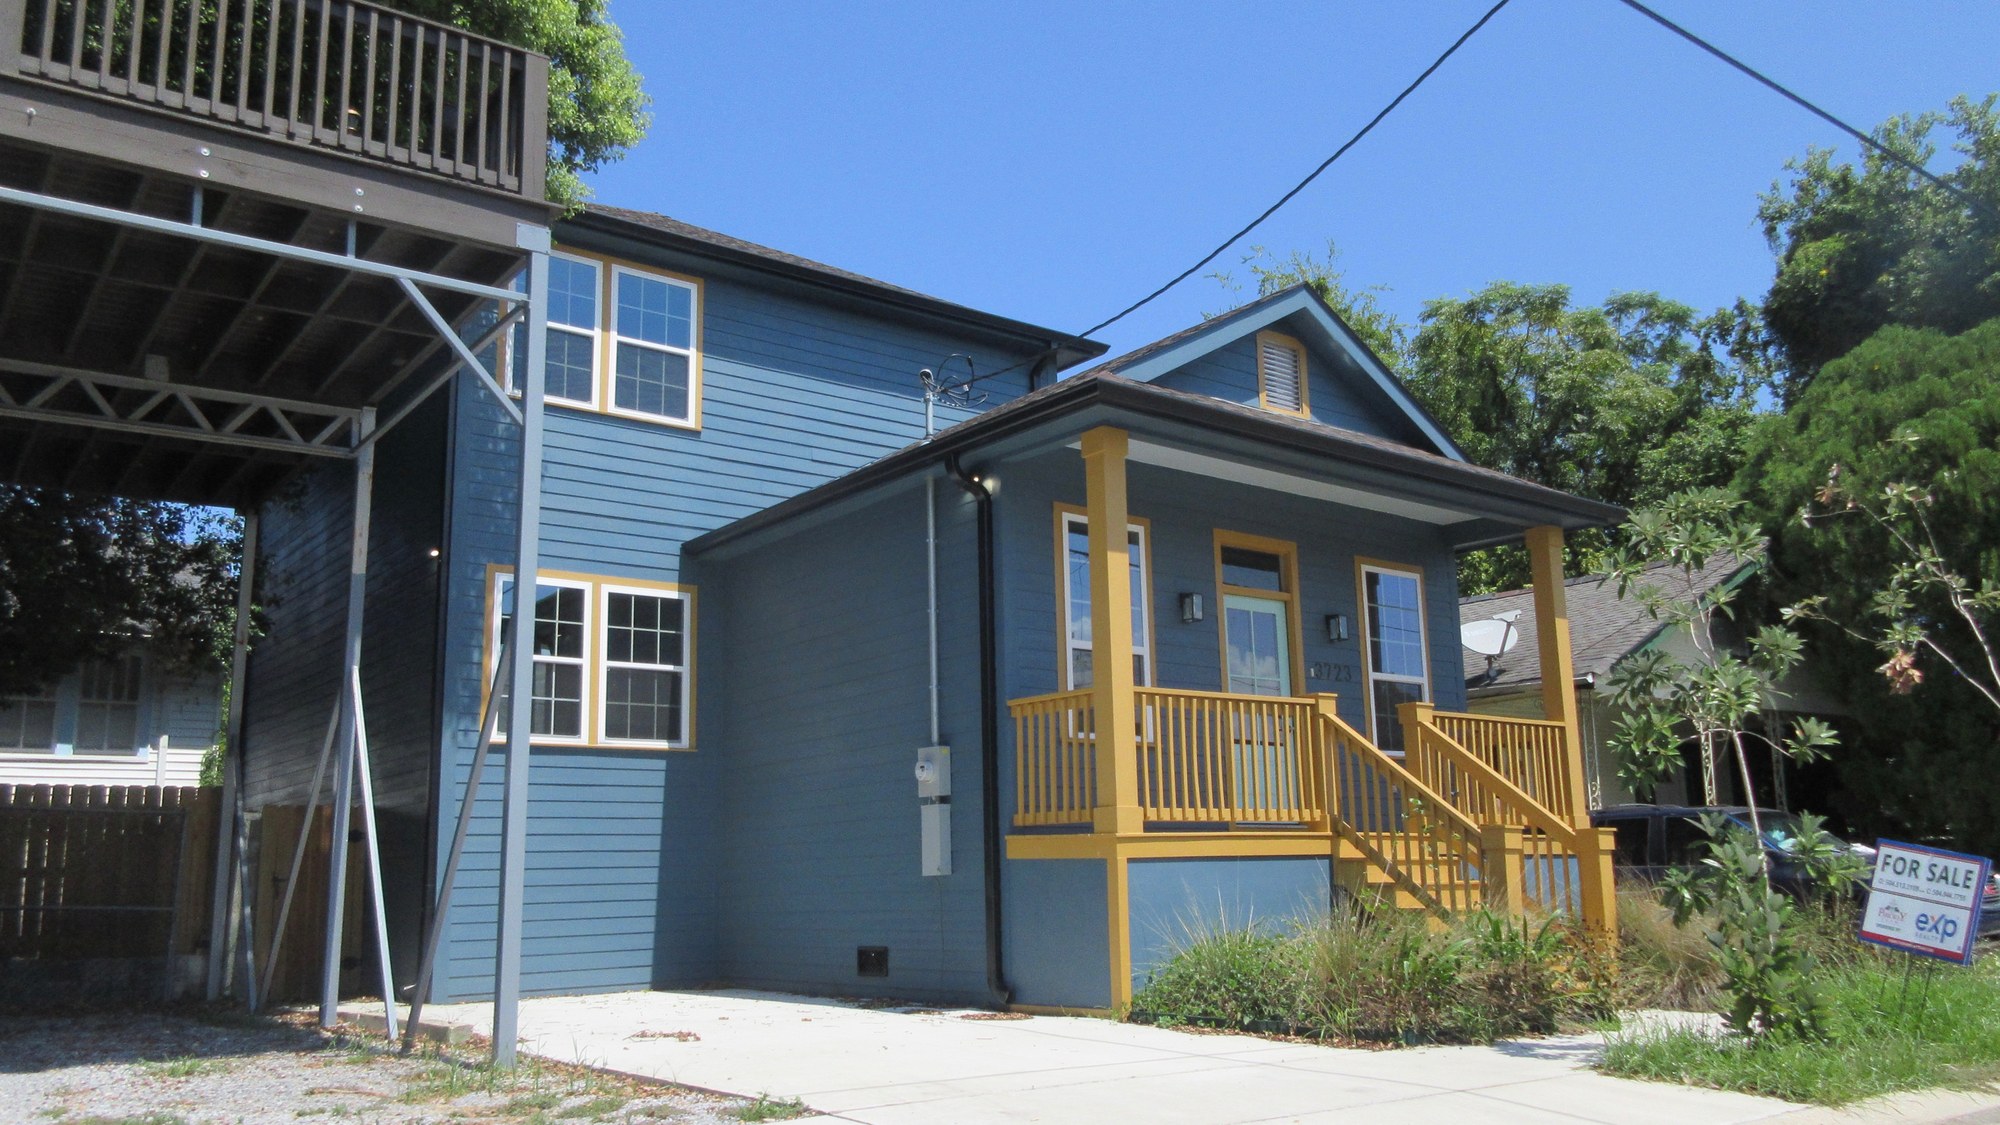
Builders broke ground on fewer new homes in August than in July, a second straight monthly pullback that masks a sharper split beneath the surface: single-family construction actually accelerated while apartment building slowed hard enough to drag the total down. The Census Bureau’s combined report with the Department of Housing and Urban Development puts the overall pace at just over 1.27 million homes a year, a number that shapes how much new housing, including the smaller units many older households look to downsize into, reaches the market over the next year.
Total Starts Fell 2.6% To A 1.275 Million Pace
Privately owned housing starts ran at a seasonally adjusted annual rate of 1,275,000 in August, down 2.6% from July and 1.2% below the August 2025 pace, according to the Census Bureau and HUD’s joint New Residential Construction report, released September 17. The agencies attach a margin of error of plus or minus 12.0 percentage points to the monthly change, wide enough that Census does not describe the decline itself as statistically certain, though the year-over-year comparison points the same direction. The annual rate is a projection of what a full year of construction would look like if August’s pace held, not a count of homes actually finished that month.
The gap the report leaves open: Census counts how many homes broke ground in August, but it says nothing about what a new roof, furnace or water heater costs a household that already owns one and isn’t moving anywhere — a job the heating, cooling and home-repair help inside the kit is built to walk through. See the home-repair help in The Senior Property Tax & Home-Cost Relief Kit.
Single-Family Construction Bucked The Overall Decline
Single-family starts actually rose 7.6% in August to an annual rate of 918,000, moving in the opposite direction of the total figure, per the same Census/HUD release. That means the 2.6% overall drop was driven entirely by the multi-family side of the market, where starts fell to an annual rate of 344,000. A household weighing whether to buy a newly built single-family home versus wait for more apartment or condo supply is looking at two segments moving in opposite directions in the same month, not one uniformly slowing construction sector.
The Multifamily Slowdown Behind The Total
Because apartment and condo buildings account for a large share of new housing supply for renters and downsizing older households alike, a pullback concentrated there has a different effect than one spread evenly across the market. Fewer multi-family starts today means fewer completed rental or smaller-footprint units reaching the market roughly a year or more from now, since building an apartment complex takes considerably longer than a single-family house. Census’s report does not forecast future rents, but the mechanical link between a construction start today and a unit available for occupancy later is why economists watch the multi-family component separately from the single-family count.
Completions Tell A Slower Story Still
Housing completions, homes actually finished and ready for occupancy, fell even more sharply than starts: down 11.9% in August to an annual rate of 1,128,000, and down 27.1% from a year earlier, according to the same Census/HUD release. Single-family completions alone fell 10.4% on the month to an annual rate of 816,000. Because a start today does not become a finished, move-in-ready home for months, the sharp year-over-year drop in completions reflects a pipeline that thinned out earlier in the construction cycle, well before August’s ground-breaking numbers were recorded.
Census attaches its own margin of error to the completions figures, plus or minus 9.7 percentage points on the monthly change and plus or minus 8.9 points on the year-over-year comparison, wide enough that the agency does not treat either single-month reading as fully conclusive on its own. Still, a 27.1% year-over-year drop is large relative to that margin, which is why the completions slowdown is read alongside the starts and permits figures rather than dismissed as statistical noise. For a buyer waiting on a specific new-construction listing to reach the market, a thinner completions pipeline can mean a longer wait between a builder’s groundbreaking announcement and a move-in date.
What A Thinner Pipeline Means For Housing Supply Overall
Taken together, August’s report describes a construction sector where fewer homes broke ground and fewer homes were finished than in July, even as building permits, the same release’s forward-looking measure, ran at an annual rate of 1,394,000, down 2.7% from July but still 3.5% above August 2025, per the same Census/HUD release. That combination matters most for households on the demand side of the market: fewer completed homes reaching buyers keeps existing-home inventory tighter than it would be with a faster pace of new construction, a dynamic that can keep both sale prices and rents firmer than they would be if builders were finishing more homes each month. Census’s report does not draw that connection explicitly, but the mechanical relationship between completions and available supply is why builders, real estate agents and housing economists watch the monthly release closely.
The gap between August’s soft starts and completions figures and the still-higher year-over-year permit count suggests the pullback is concentrated in projects already underway rather than in future planning, since permits filed today typically take months to become the starts and completions reported in a later release. For an older household budgeting around whether to buy new construction, rent, or stay in a current home, that lag means today’s permit total is a better guide to what will be available a year from now than to what is on the market this month.
The Repair Bill A Slower Building Pace Leaves Standing
Census’s August report shows total housing starts down 2.6% to a 1.275 million pace even as single-family construction rose, a split that changes how much new housing reaches the market but does nothing for a household staying in the home it already owns. That household still faces its own maintenance and repair decisions on a fixed income, separate from whatever new supply is or isn’t breaking ground nationally.
The Senior Property Tax & Home-Cost Relief Kit lays out help with heating, cooling and home repairs alongside property-tax freezes and exemptions, organizing both sides of what it costs to stay in a home rather than move into a newly built one.
Compare the property-tax and repair-help sections in The Senior Property Tax & Home-Cost Relief Kit.
This article was produced with AI assistance and checked against the primary sources linked above.