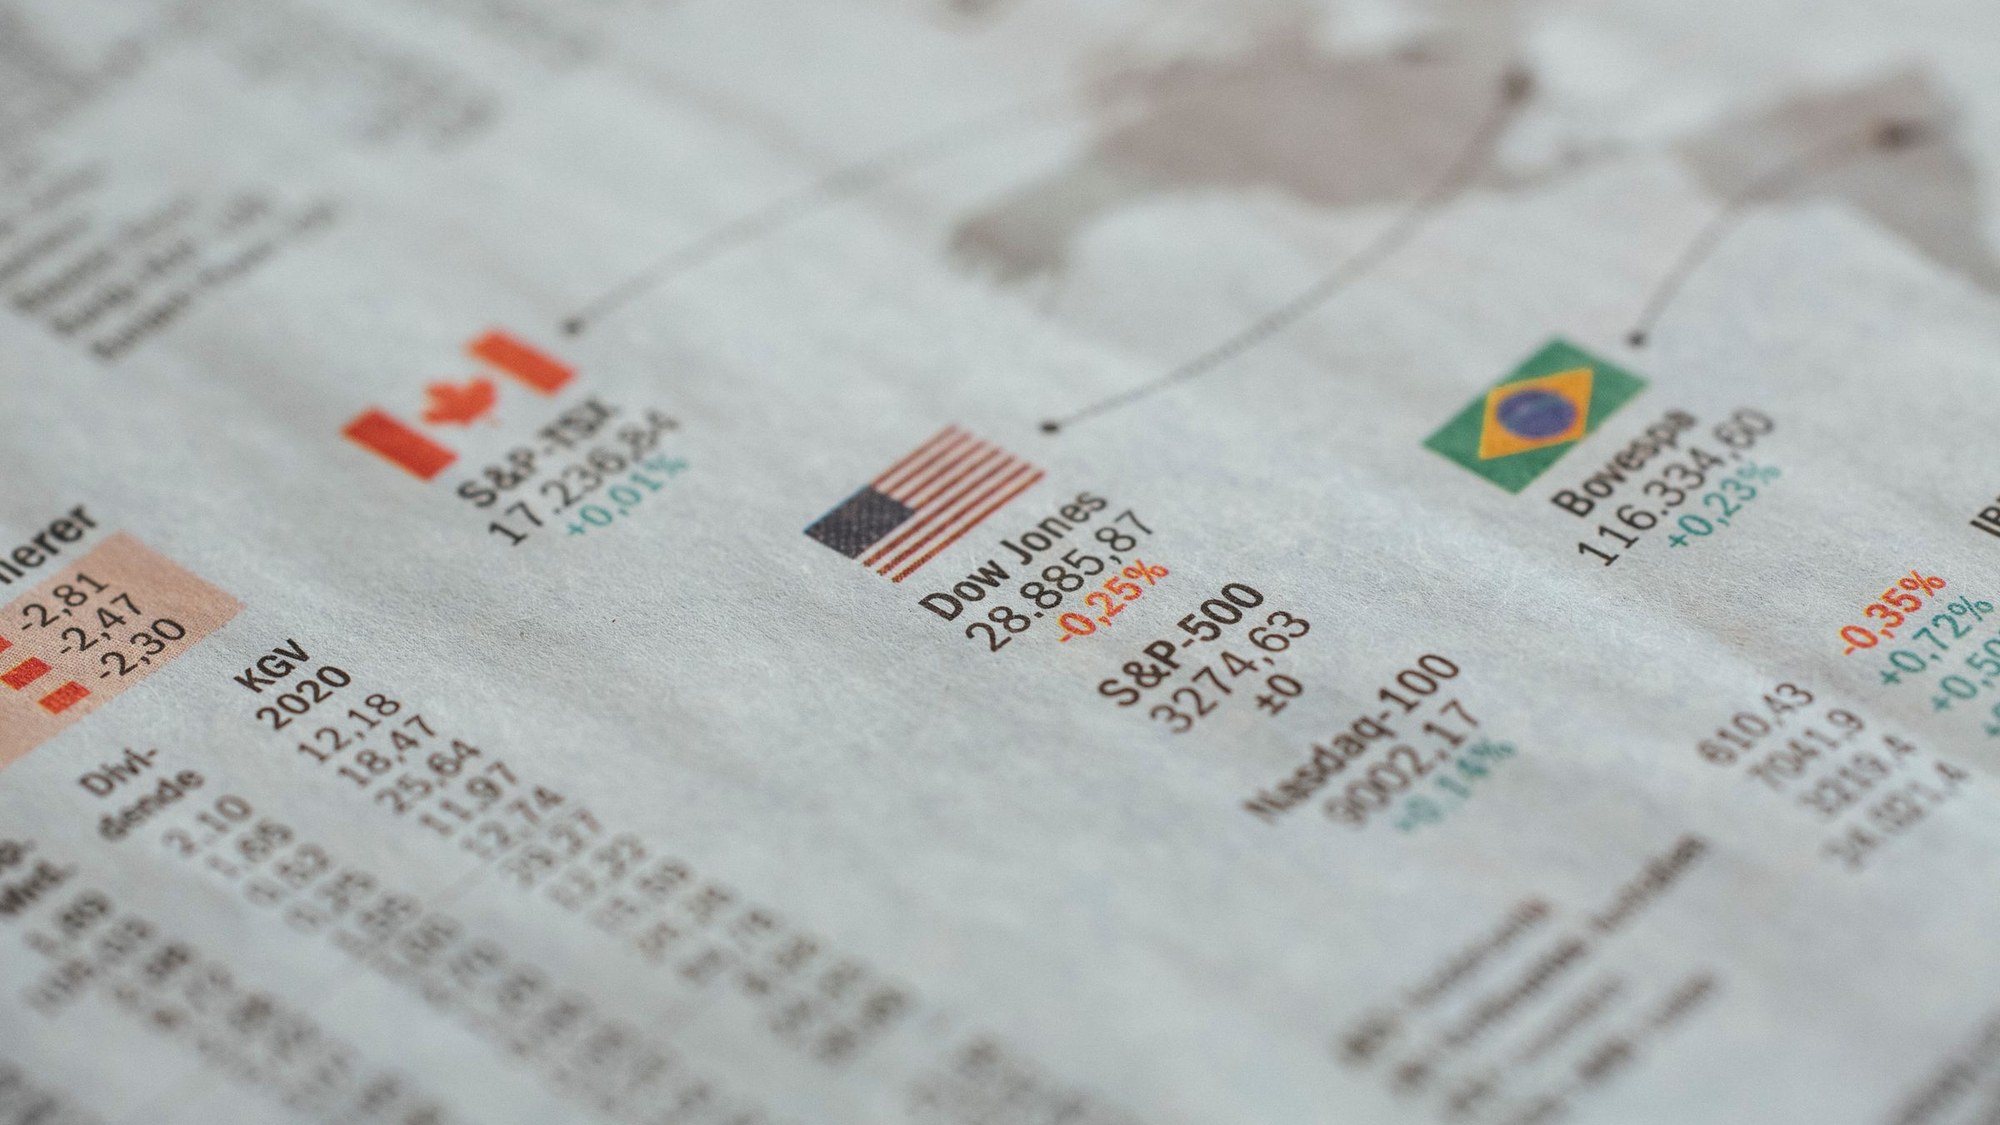
Of Wall Street’s three major stock indexes, the Nasdaq composite took the hardest hit on Friday, falling 747.73 points, or 2.9%, to 25,437.00. The S&P 500 lost 1.8% and the Dow Jones Industrial Average 1.1%, so the Nasdaq’s drop was steeper than either. The Associated Press tied the selloff to tech stocks and worries that the frenzy around artificial intelligence had pushed prices too high.
The Nasdaq is the index most closely tied to technology companies, and a fund that leans on tech and AI names can move more like it than like the Dow. A fund’s own fact sheet lists its largest holdings, which is where an owner can see how much of it sits in the names behind Friday’s drop.
Stay ahead of government payment news: Miss an enrollment or claim deadline and the money can be gone. Join the Retirement Money Brief and we’ll send you our 2026 Government Check Reality Tracker as a welcome gift.
Get the Brief + the check tracker →
We may earn a commission from links on this page.
How wide was the gap between the three indexes?
In points, the Nasdaq’s 747.73 compares with 572.25 for the Dow, which closed at 51,770.31, and 140.32 for the S&P 500, which closed at 7,580.07. In percentage terms, the Nasdaq’s 2.9% was about two and a half times the Dow’s 1.1% and well beyond the S&P 500’s 1.8%, the worst day for that index since June.
Smaller companies fell too, but less. The Russell 2000 dropped 1.7% to 2,811.84, and it still ended the week 1.3% higher while the Nasdaq finished the week down 2%.
The same Friday therefore produced very different results depending on the fund. An account tracking the Dow lost about $1.10 for every $100 invested, one tracking the S&P 500 about $1.80 and one tracking the Nasdaq about $2.90, before fees and dividends.
Was this the Nasdaq’s first bad day that week?
No. The Nasdaq was already sliding before Friday. Daily closes from the Federal Reserve Bank of St. Louis show the composite at 26,549.85 on Wednesday, Oct. 28, and 26,184.72 on Thursday, Oct. 29, a loss of 365.13 points, or about 1.4%.
The S&P 500, by comparison, barely moved on Thursday, slipping from 7,743.98 to 7,720.39, a loss of 23.59 points, or about 0.3%, so the tech-heavy index was already weakening on its own.
Friday’s 747.73-point drop came on top of that. From Wednesday’s close to Friday’s 25,437.00, the composite shed 1,112.85 points, or about 4.2%, in two sessions.
How does the Nasdaq compare with a month ago?
The Nasdaq composite closed Sept. 30 at 26,861.06. Friday’s 25,437.00 is 1,424.06 points, or about 5.3%, below that level, which makes the composite the only one of the three major indexes that finished October with a loss of more than 1%. The Dow finished the month higher, and the S&P 500 ended it about 0.9% lower.
The week tells a similar story. The Nasdaq lost 518.34 points, or 2%, from the prior Friday, against 444.85 points, or 0.9%, for the Dow and 43.61 points, or 0.6%, for the S&P 500.
Which companies drove the worry?
The AP singled out two. Intel fell almost 29%, its worst day since 1974, after the chipmaker forecast profit below analysts’ expectations. Amazon’s latest profit report intensified worries about how much companies are spending on AI investments.
Treasury yields fell as investors sought safer assets, even though oil prices rose. The AP did not say how long the pressure on tech shares might last, and nothing in its market table predicts it.
Is the Nasdaq still ahead for the year?
It is. After Friday the composite was up 2,195.01 points, or 9.4%, for 2026. That compares with 10.7% for the S&P 500 and 7.7% for the Dow, so the Nasdaq sits between the two despite carrying the day’s biggest loss. In points, the S&P 500 is up 734.57 and the Dow 3,707.02 for the year, according to the AP.
On Sept. 30 the composite stood up 15.6% for the year, so roughly six percentage points of its gain disappeared in a month. A one-day drop of 2.9% does not change what a fund held on Jan. 1 is worth against its starting value, but it does change what an account holds on the day money is needed. That timing, not the index level, is what separates a paper loss from a real one.
Is a tech-heavy fund covering money you will need within the year?
Friday’s 2.9% Nasdaq drop landed on top of a two-day slide of about 4.2%. Anyone who planned to pull from a tech-heavy fund for next year’s expenses faced that swing with no warning.
“Make Your Savings Pay You” is an 11-page guide to high-yield savings for the cushion you might need this year and to keeping every dollar insured, even above $250,000 at one bank. Its safe-savings menu lays out 10 moves in order, so the cash a household cannot risk has a home that does not follow the Nasdaq.
Get the 10-move safe-savings menu in the Make Your Savings Pay You guide →
This article was produced with AI assistance and edited for accuracy against the sources linked above.