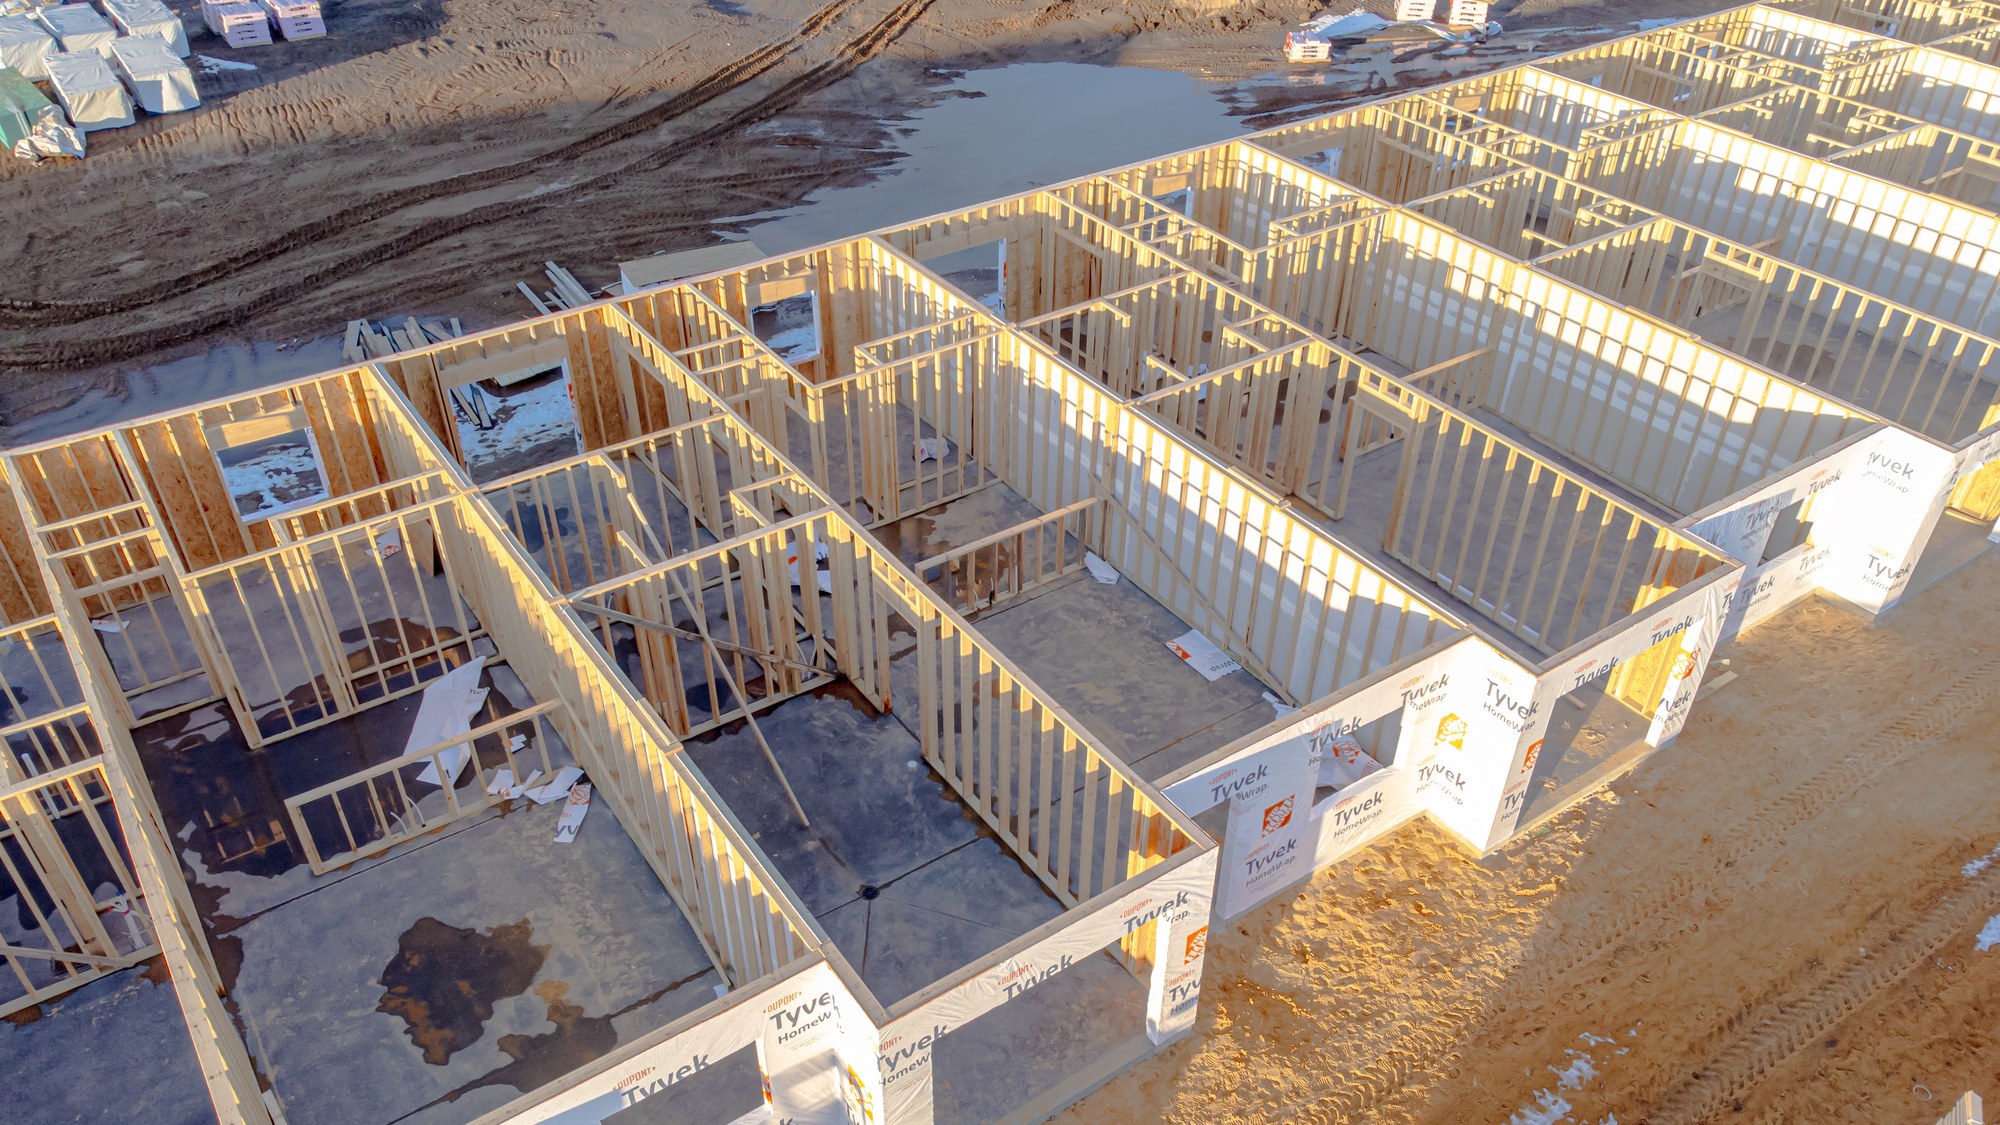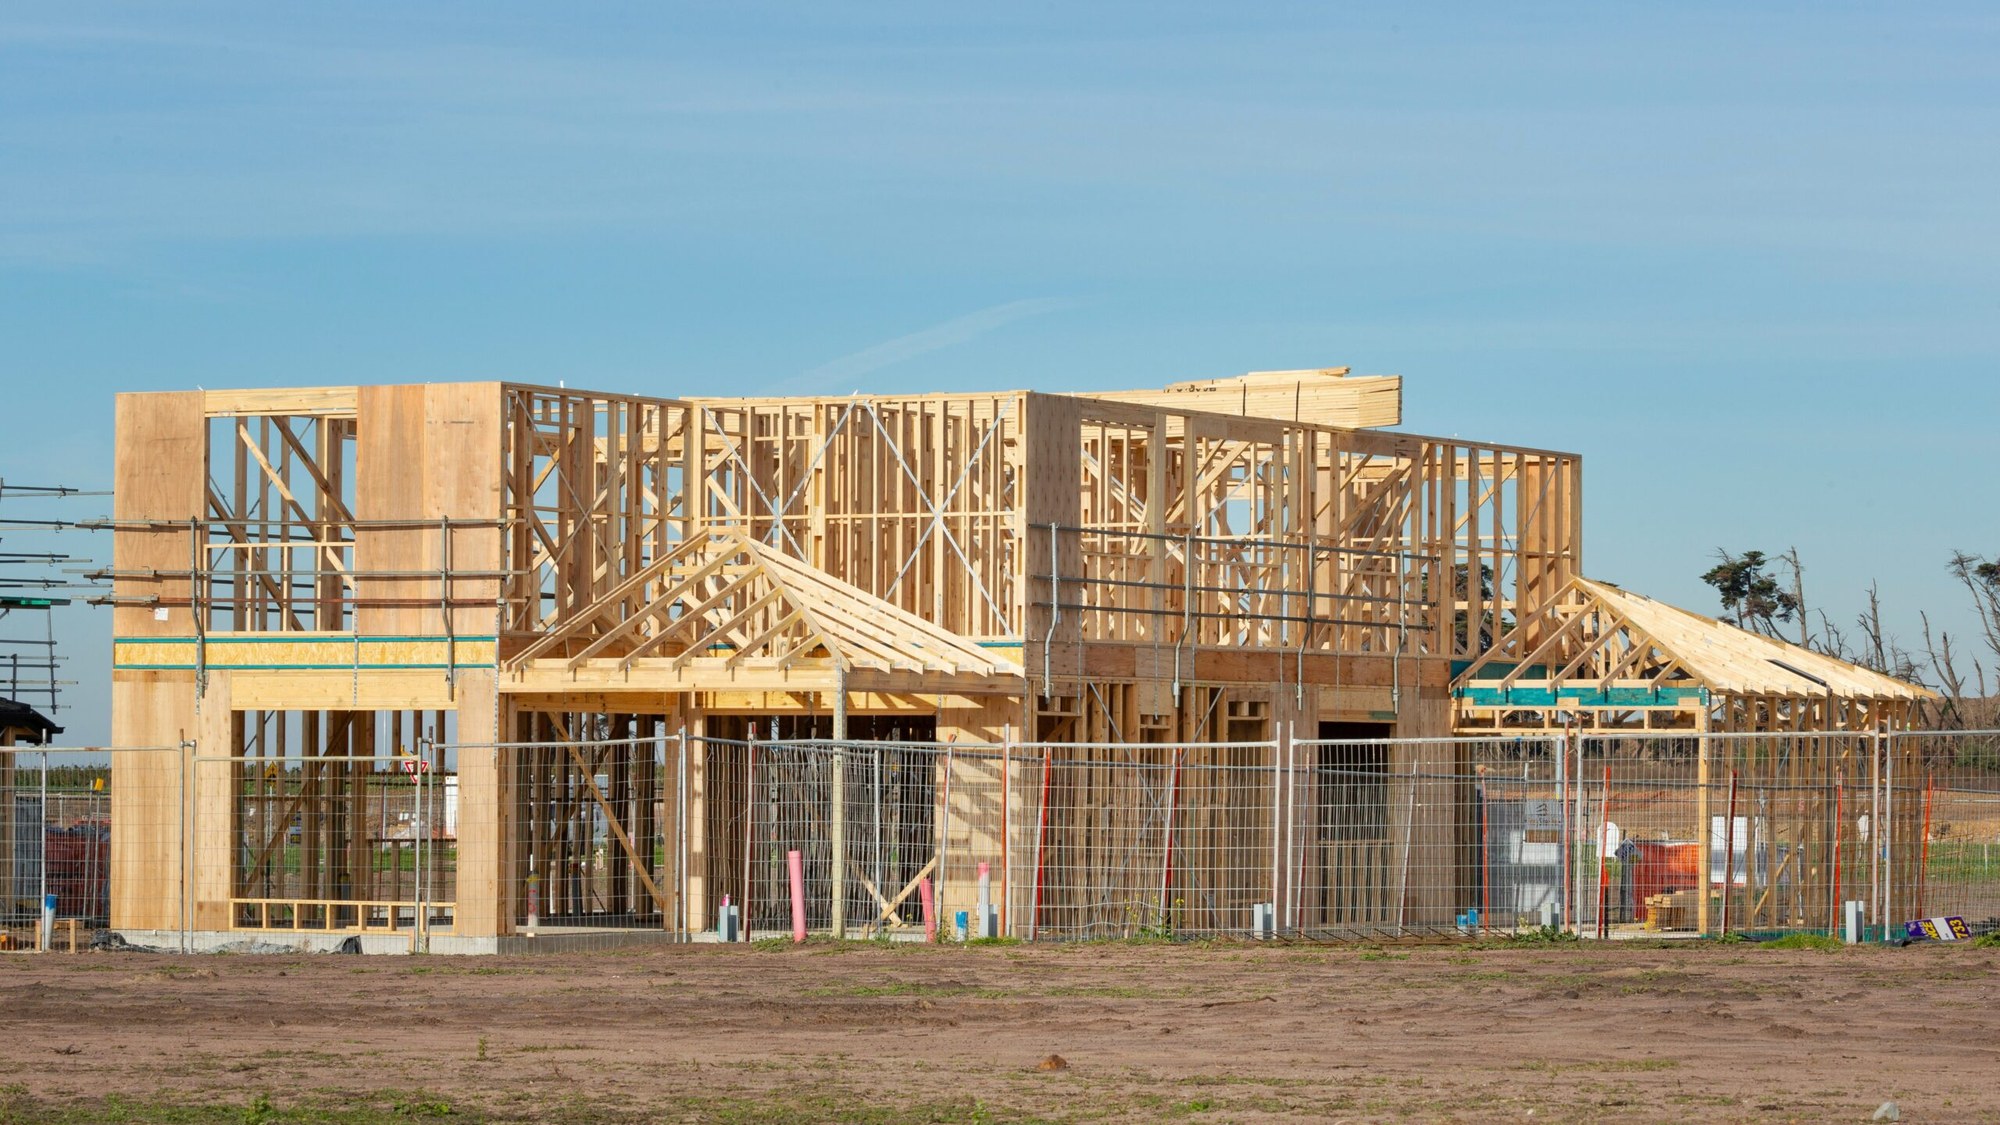
Homebuyers who spent the past several years losing out in frenzied bidding wars are finding something they have not seen in a long time: choice. Newly built homes are sitting on the market longer, and the supply of unsold inventory has climbed to levels not recorded since before the pandemic. The shift is giving buyers room to negotiate on price, ask for closing-cost help, and walk away from deals that do not pencil out.
Rising inventory is rewriting the balance of power
The change shows up clearly in federal housing data. The Census Bureau time series on new residential construction tracks housing completions against sales activity, and the gap between the two has widened steadily. Builders are finishing homes faster than buyers are signing contracts, which means completed but unsold units are stacking up in subdivisions across the country. That dynamic pushes months’ supply higher, a metric that measures how long it would take to sell every new home on the market at the current sales pace.
During the frenzy of 2021 through 2023, months’ supply stayed compressed. Buyers competed aggressively, often waiving inspections and paying well above asking price just to secure a contract. The reversal now underway has practical consequences for families shopping this spring and summer. Higher inventory means fewer bidding wars, slower price appreciation, and more willingness from builders to offer incentives such as mortgage-rate buydowns or upgraded finishes.
Census data and the above-list-price threshold
The federal government’s new-home sales series publishes monthly estimates of transactions, median prices, and inventory levels. Those releases form the backbone of any serious analysis of where the market stands. They show how many units are completed, under construction, or not yet started, alongside the number of homes sold and the resulting months’ supply.
If the quarterly pace of inventory growth visible in that series continues, the share of new homes sold above list price could plausibly fall below the level last seen in late 2019, when the market was closer to balance and buyers more routinely secured concessions. While the federal reports do not directly track contract prices relative to list, the combination of rising inventory and lengthening marketing times points toward a softer negotiating environment for sellers.
That hypothesis rests on a straightforward relationship: as months’ supply rises, builders lose pricing power and begin cutting asking prices or adding sweeteners to move units. Carrying costs on finished homes, including property taxes, insurance, utilities, and loan interest, eat into margins every month a house sits empty. Builders have a strong financial incentive to close deals quickly, even if it means accepting less than they originally listed or paying points to reduce a buyer’s mortgage rate.
Recent monthly tables in the current sales release underscore that tension. Completed inventory has drifted higher at the same time sales volumes have cooled from their peak, nudging months’ supply above the ultra-tight conditions of the pandemic boom. Federal Reserve Economic Data hosted by the St. Louis Fed and resources available through the Department of Housing and Urban Development allow researchers and buyers alike to cross-check these trends in near-real time. The convergence of rising completions and softer demand is visible across multiple federal datasets, not just one report.
Gaps in the data and what buyers should watch next
The federal releases have real limits. The monthly New Residential Sales report provides only national aggregates, not regional or metro-level breakdowns of inventory and sales pace. A buyer in Austin faces a very different market than one in Cleveland, and the headline numbers cannot capture that variation. Builder-level data on specific incentives, such as how many companies are offering rate buydowns or covering closing costs, does not appear in the Census or HUD datasets, leaving analysts to infer behavior from pricing and volume alone.
No fresh public statements from major builders about their willingness to negotiate have surfaced in the most recent federal releases. That means the connection between rising months’ supply and specific dollar-value concessions remains an inference drawn from the data pattern rather than a confirmed policy shift announced by any single company. Buyers should therefore treat national figures as a backdrop, not a script.
For households heading into the market, the most useful approach is to combine these broad indicators with hyperlocal intelligence. Tracking changes in days on market for comparable new homes, monitoring whether nearby subdivisions are advertising incentives, and asking sales agents directly about flexibility can reveal how much leverage a buyer truly has. In communities where completed inventory is visibly accumulating and model homes sit quiet on weekends, the national story of rising supply and softening prices is likely playing out in full. In tighter submarkets, by contrast, the balance of power may still favor builders, even as the broader data point toward a more buyer-friendly era.