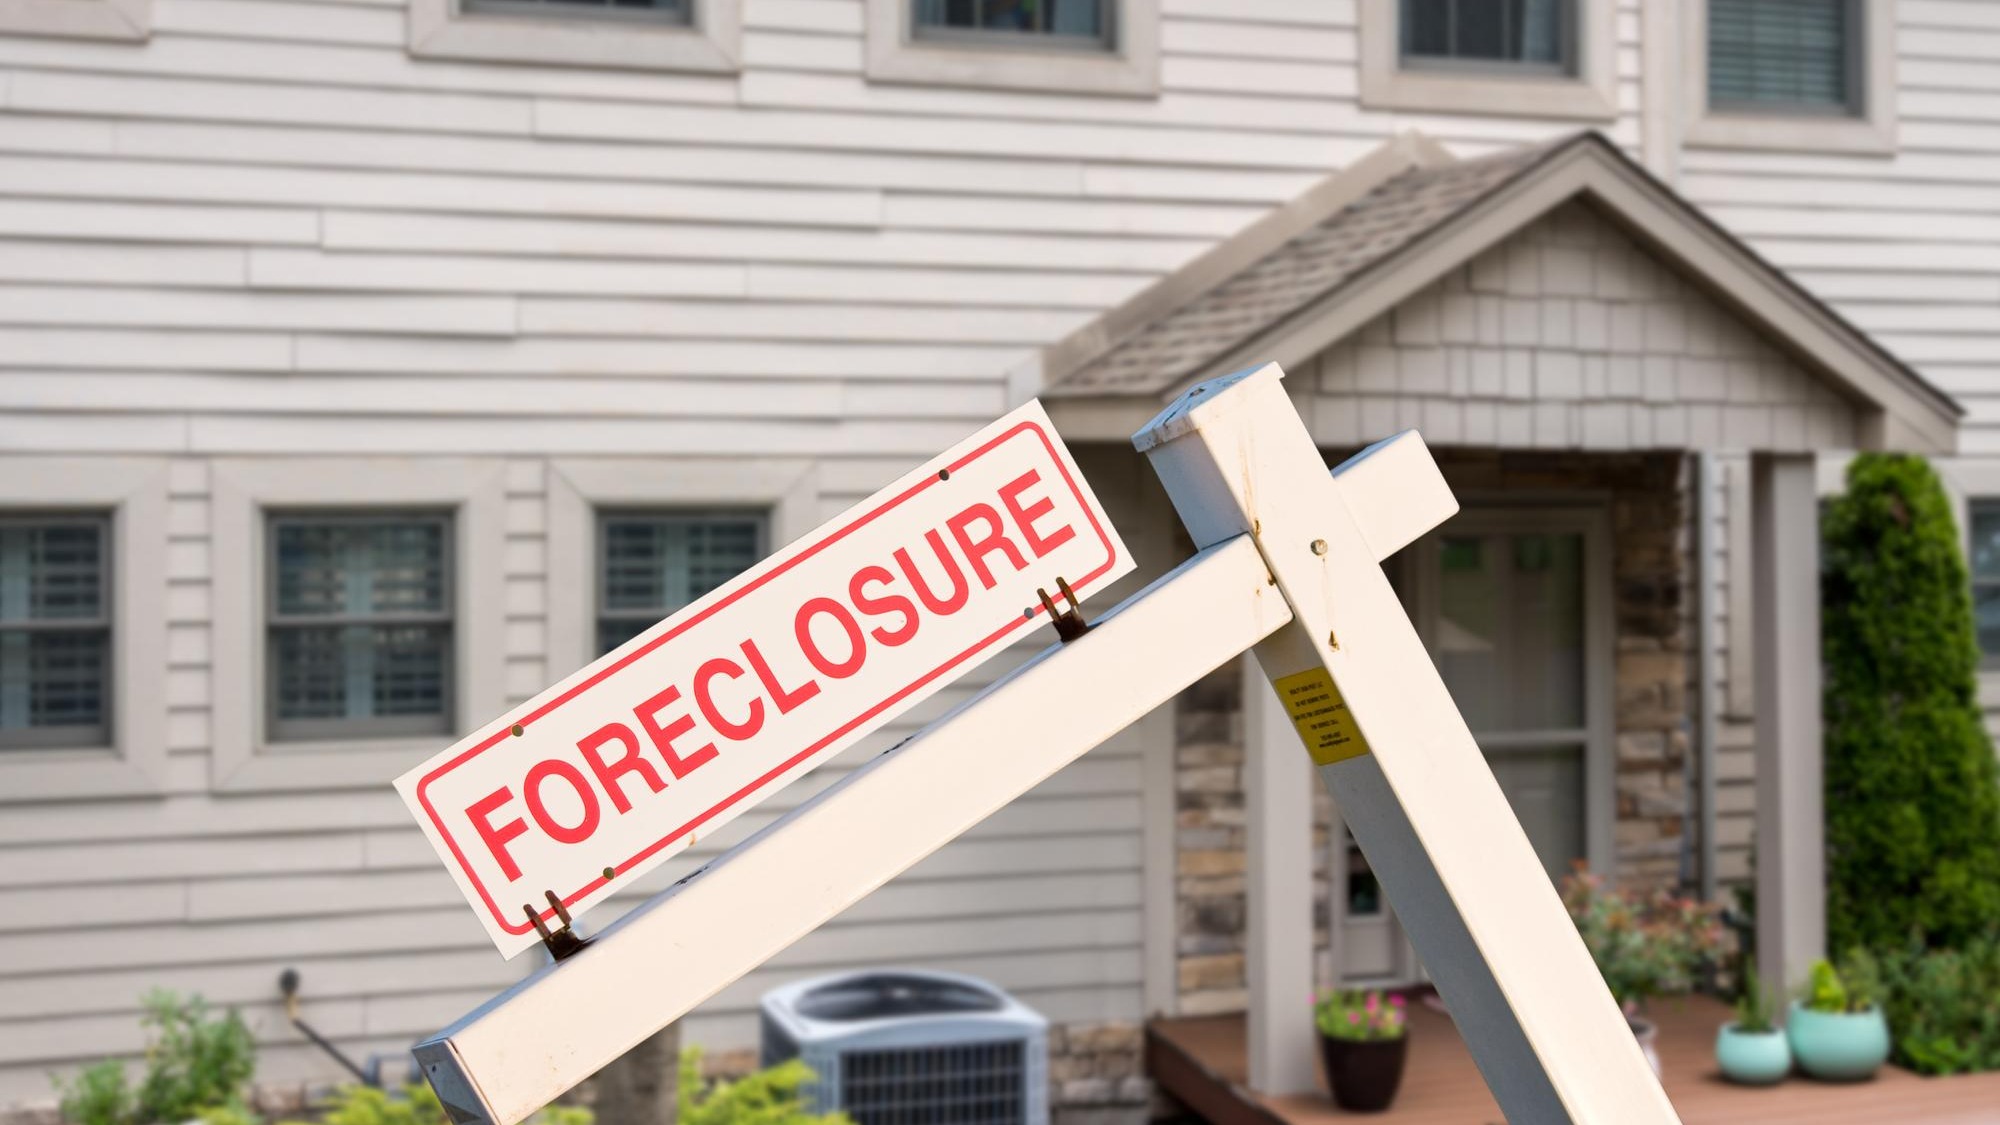
Homeowners across the United States faced a sharper wave of new foreclosure filings last month, with 27,304 foreclosure starts recorded in May, a 13 percent increase compared with the same month a year earlier. That year-ago baseline stood at 24,165 starts, according to ATTOM data. The jump arrived even as overall foreclosure activity dipped slightly from April, creating a split signal: month-to-month pressure eased, but the longer trend line moved decisively upward.
A 13 percent annual jump in foreclosure starts and what it signals
The tension in the latest numbers sits in the gap between short-term relief and longer-term strain. A slight monthly decrease from April suggests seasonal factors or servicer timing may have slowed new filings for a few weeks. But the 13 percent year-over-year increase tells a different story: more borrowers are falling behind on payments now than at this point last year, and lenders are acting on those delinquencies at a faster clip.
One question that the national count alone cannot answer is where exactly the pain concentrates. Foreclosure procedures differ sharply by state. In judicial-foreclosure states, lenders must file a lis pendens, a written notice of a court proceeding that affects property ownership, as Cornell Law School defines it. In non-judicial states, the process moves through a trustee sale without court involvement, often producing faster timelines but different filing categories. If the 13 percent rise is driven disproportionately by judicial states where lis pendens filings stack up in court dockets, the geographic distribution of risk could look very uneven. State-level breakdowns from primary county records would be needed to confirm or reject that pattern, and no such breakdown appears in the current ATTOM release.
ATTOM data and the 24,165 baseline anchoring the comparison
The core evidence rests on ATTOM’s national tracking of foreclosure filings across all stages, from default notices through bank repossessions. For May 2025, ATTOM reported 24,165 foreclosure starts. That figure serves as the baseline for the 13 percent calculation that produces the 27,304 total recorded a year later. Both numbers come from the same data pipeline, which aggregates county-level records across the country and is disseminated through outlets such as the Prnewswire media platform.
The slight monthly decrease in overall foreclosure activity reported for May 2025 adds useful context. It shows that even in the baseline period, activity was already pulling back on a month-to-month basis while still running higher than the post-pandemic lows that characterized 2021 and 2022. The annual comparison therefore measures growth off a period that was itself in mild retreat, making the 13 percent climb more striking. Lenders were not simply catching up on a backlog from a quiet prior month; they were filing at a structurally higher rate than the same seasonal window one year before.
For borrowers, the practical consequence is direct. A foreclosure start means a lender has formally initiated the process to reclaim a property. In judicial states, that means a court filing and a legal clock that begins ticking. In non-judicial states, a notice of default triggers a timeline that can lead to auction with far less court oversight. Either way, the start is the point at which missed payments move from a private problem between borrower and servicer into a public legal proceeding that can culminate in the loss of a home.
What rising starts mean for borrowers and neighborhoods
Even if many foreclosure starts never end in completed repossessions-because borrowers cure the default, negotiate loan modifications, or sell the property-the increase in filings still matters. Each new case adds stress to households already juggling inflation, higher interest costs, and, in some markets, softening home prices. For families with limited savings, a single disruption in income can turn into a missed payment and, months later, a formal default notice.
Neighborhoods feel the effects as well. A surge in foreclosure activity can translate into more vacant or distressed properties, especially in communities where resale demand is weaker. Vacancies can drag down nearby property values and strain local services as code-enforcement and safety concerns rise. While the current numbers do not yet point to a crisis on the scale of the late-2000s housing bust, the double-digit annual gain in starts is a warning sign that some local markets may be moving into a more fragile phase.
Policymakers and housing advocates often track this kind of data as an early indicator of stress that may not yet appear in headline unemployment or income figures. Rising foreclosure starts can surface first in lower-income neighborhoods and among borrowers with thinner financial cushions, revealing pockets of vulnerability that broader economic statistics gloss over. Monitoring these trends in real time, through data feeds and dashboards that require tools such as a Prnewswire login, helps agencies and nonprofits target counseling, legal aid, and emergency assistance where it is most needed.
Looking ahead
The latest ATTOM figures leave open several questions. Without a detailed state-level and metropolitan breakdown, observers cannot yet say whether the rise in foreclosure starts is concentrated in a handful of overextended markets or spread broadly across the country. Nor is it clear how much of the increase reflects the unwinding of pandemic-era protections versus new financial stress tied to today’s higher borrowing costs.
What is clear is that the direction of travel has turned less favorable for struggling homeowners. A modest monthly dip in overall activity offers some near-term reassurance, but the 13 percent annual jump in foreclosure starts points to mounting pressure beneath the surface. If that pattern persists through the rest of the year, more borrowers will find themselves navigating the complex and often intimidating foreclosure process-and more communities will be forced to grapple with the economic and social fallout.