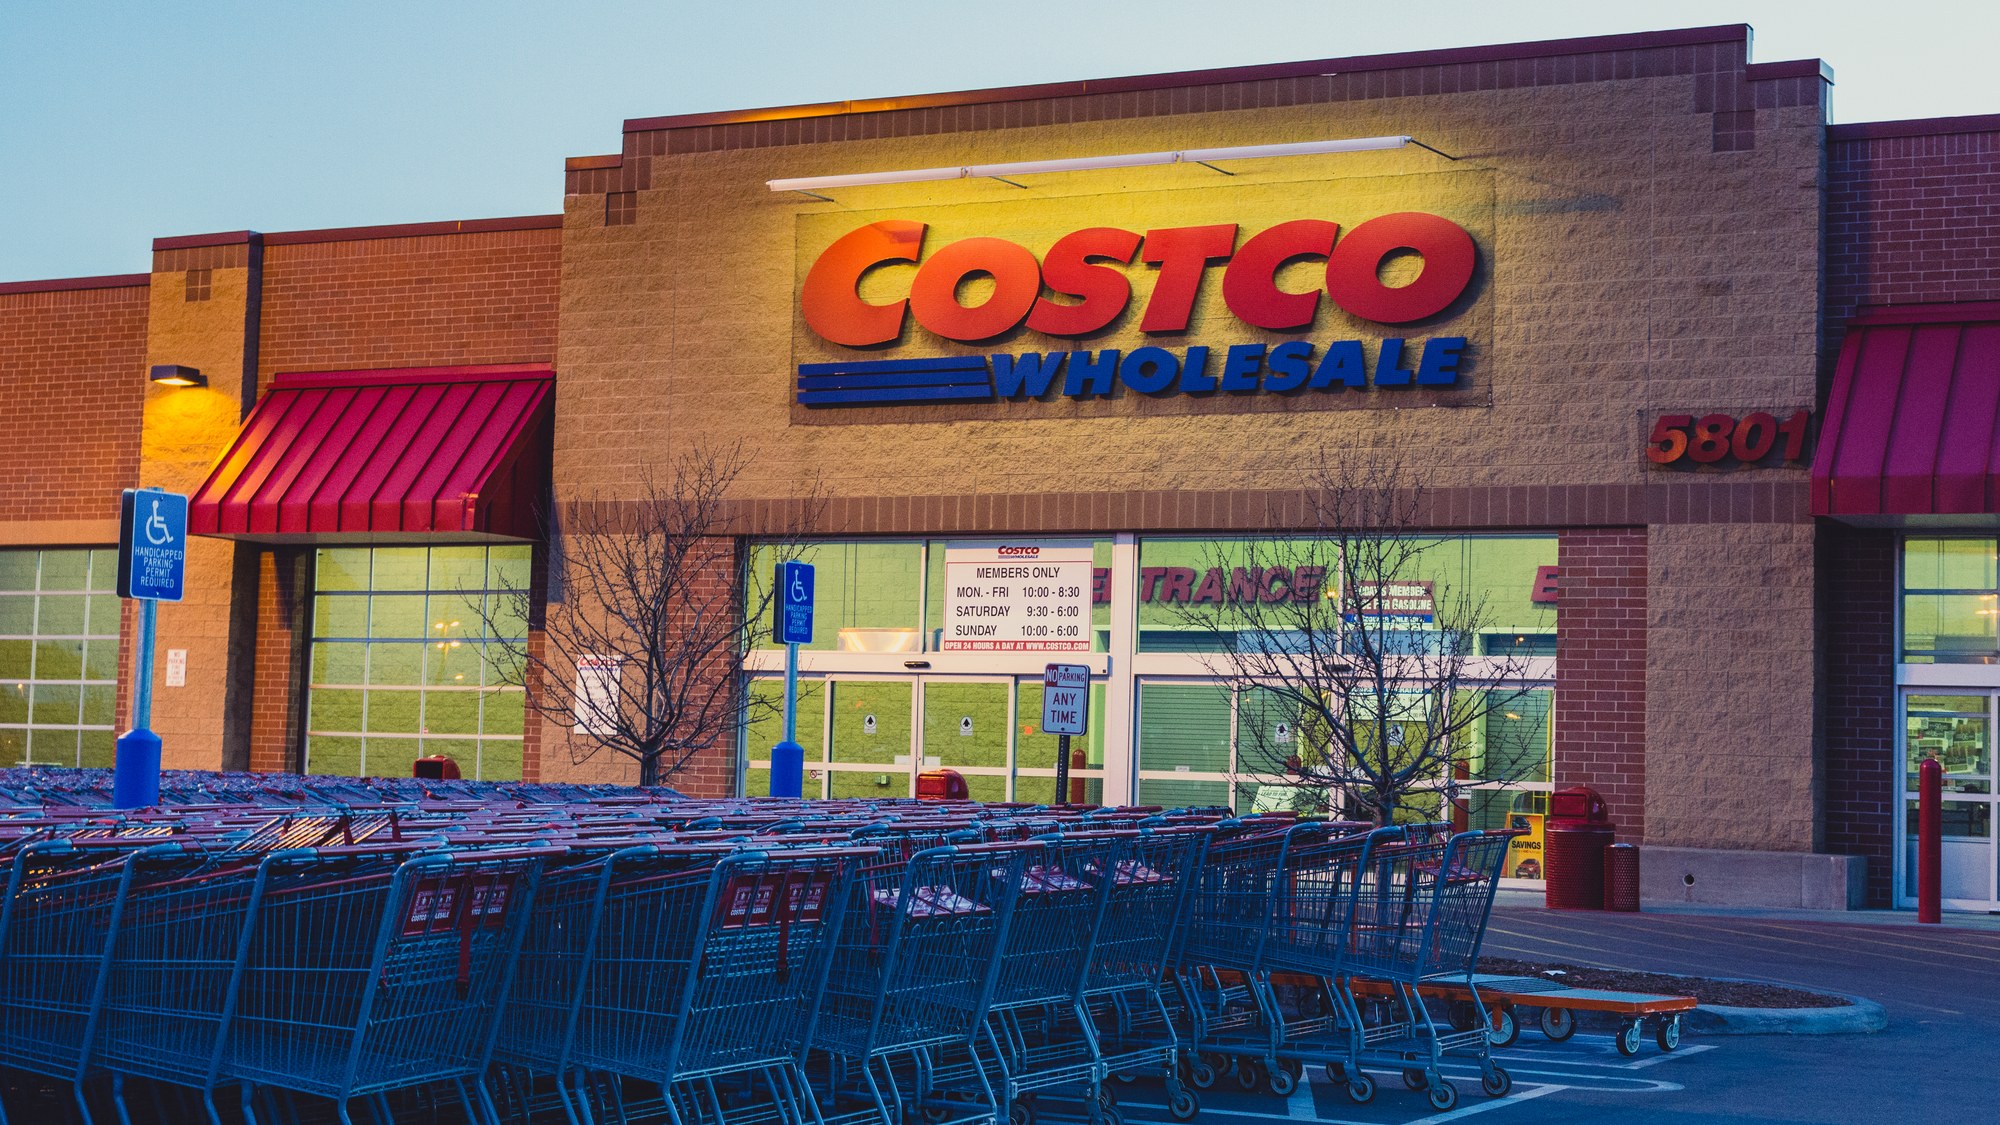
Costco’s total comparable sales rose 11.4 percent in September, but strip out gasoline prices and currency swings and the figure drops to 7.6 percent. The 3.8-point gap is the first thing to understand about the $30.02 billion in net sales the warehouse chain reported for its five-week September month. The company said that was up 13.0 percent from $26.58 billion a year earlier.
Anyone who owns Costco shares, or follows the retailer as a gauge of how households are spending, has to decide which number to take as the real pace of demand. Costco’s Oct. 7 release covers the five weeks ended Oct. 4, 2026, and it gives both versions of the growth rate, so the answer depends on whether gas and the dollar’s moves count.
The next number to follow is Costco’s October sales result, which covers the period after the Oct. 4 close of the September month.
Get the next update the morning it lands →
Five weeks against last year’s comparison
Costco reports by retail month, and September ran five weeks, ending Oct. 4. Net sales for the month were $30.02 billion. That is a company-wide total that includes online sales as well as sales at its warehouses, and it is $3.44 billion more than the $26.58 billion Costco reported for the same month last year, the difference behind the 13.0 percent gain.
The release also flags a calendar effect. Labor Day fell one week later this year in the United States and Canada, and Costco says the shift added a little more than 50 basis points, or about half a percentage point, to September total and comparable sales. The retailer did not give a dollar figure for that effect.
Comparable sales, with and without gas and currency
Comparable sales measure warehouses and sites open long enough to compare against the prior year. The reported totals for September were:
- Total company: 11.4 percent, or 7.6 percent excluding changes in gasoline prices and foreign exchange.
- United States: 12.5 percent, or 8.0 percent excluding gas and currency.
- Canada: 6.3 percent, or 4.9 percent.
- Other International: 10.8 percent, or 7.7 percent.
The release does not put a dollar amount on what higher gas prices and currency changes contributed, so the gap between each pair is the best indication of their size. In the United States the difference is 4.5 points, the widest of the three regions. Canada’s gap is 1.4 points and Other International’s is 3.1.
Digital sales and the warehouse count
Digitally enabled sales rose 19.0 percent as reported and 19.1 percent excluding foreign exchange. At 19.0 percent, digital growth ran about two and a half times the 7.6 percent company-wide comparable figure that excludes gas and currency. Costco operates e-commerce sites in the United States, Canada, the United Kingdom, Mexico, South Korea, Taiwan, Japan, Australia and China.
The company currently operates 939 warehouses. The U.S. and Puerto Rico account for 647, Canada has 115, Mexico 43, Japan 37, the United Kingdom 29, South Korea 20, Australia 15, Taiwan 14, China 7, Spain 5, France 3 and Sweden 2, plus one each in Iceland and New Zealand. At 647 of 939, the U.S. and Puerto Rico hold about 69 percent of the chain’s warehouses, which leaves 292 warehouses in other countries, nearly a third of the base. Canada and Other International posted the smaller ex-gas gains, 4.9 and 7.7 percent, against 8.0 percent in the United States.
What one month does and does not show
A monthly sales report is a top-line figure. It does not give profit, margins, membership results or spending per visit, and the release carries no quotes from executives and no date for the next report. A recorded management message stays on the investor site through 4 p.m. Pacific time on Oct. 14.
Because Labor Day moved a week later, the comparison with last September is not perfectly clean, and Costco itself says the holiday added a little more than 50 basis points. Of the figures in the release, comparable sales excluding gas and currency come closest to an underlying read on shopping traffic and basket size, at 7.6 percent for the company and 8.0 percent in the United States.
Reading a retailer’s monthly sales report
Costco posts its sales results on its investor-relations site, and the September sales release is the free source for every number above. Anyone tracking the stock or the retailer’s results can line up the four headline measures from each month: net sales, total comparable sales, comparable sales excluding gas and currency, and digital growth.
When the figures move in different directions, the footnotes explain why. This month the explanation was gasoline prices, currency and the Labor Day shift. The same two-column comparison, with and without gas and currency, shows up for the United States, Canada and Other International, so each region can be read the same way.
For the September month, those four measures read $30.02 billion, 11.4 percent, 7.6 percent and 19.0 percent. The month closed Oct. 4, 2026, and the release is dated Oct. 7.
More Financial Reading
- 24 Ways to Stretch a $2,087 Social Security Check
- 17 Places to Find Your Share of the $4.25 Billion States Give Back
- 18 Ways Out of 22% Credit Card Interest
This article was produced with AI assistance and reviewed by The Financial Wire’s editorial team.