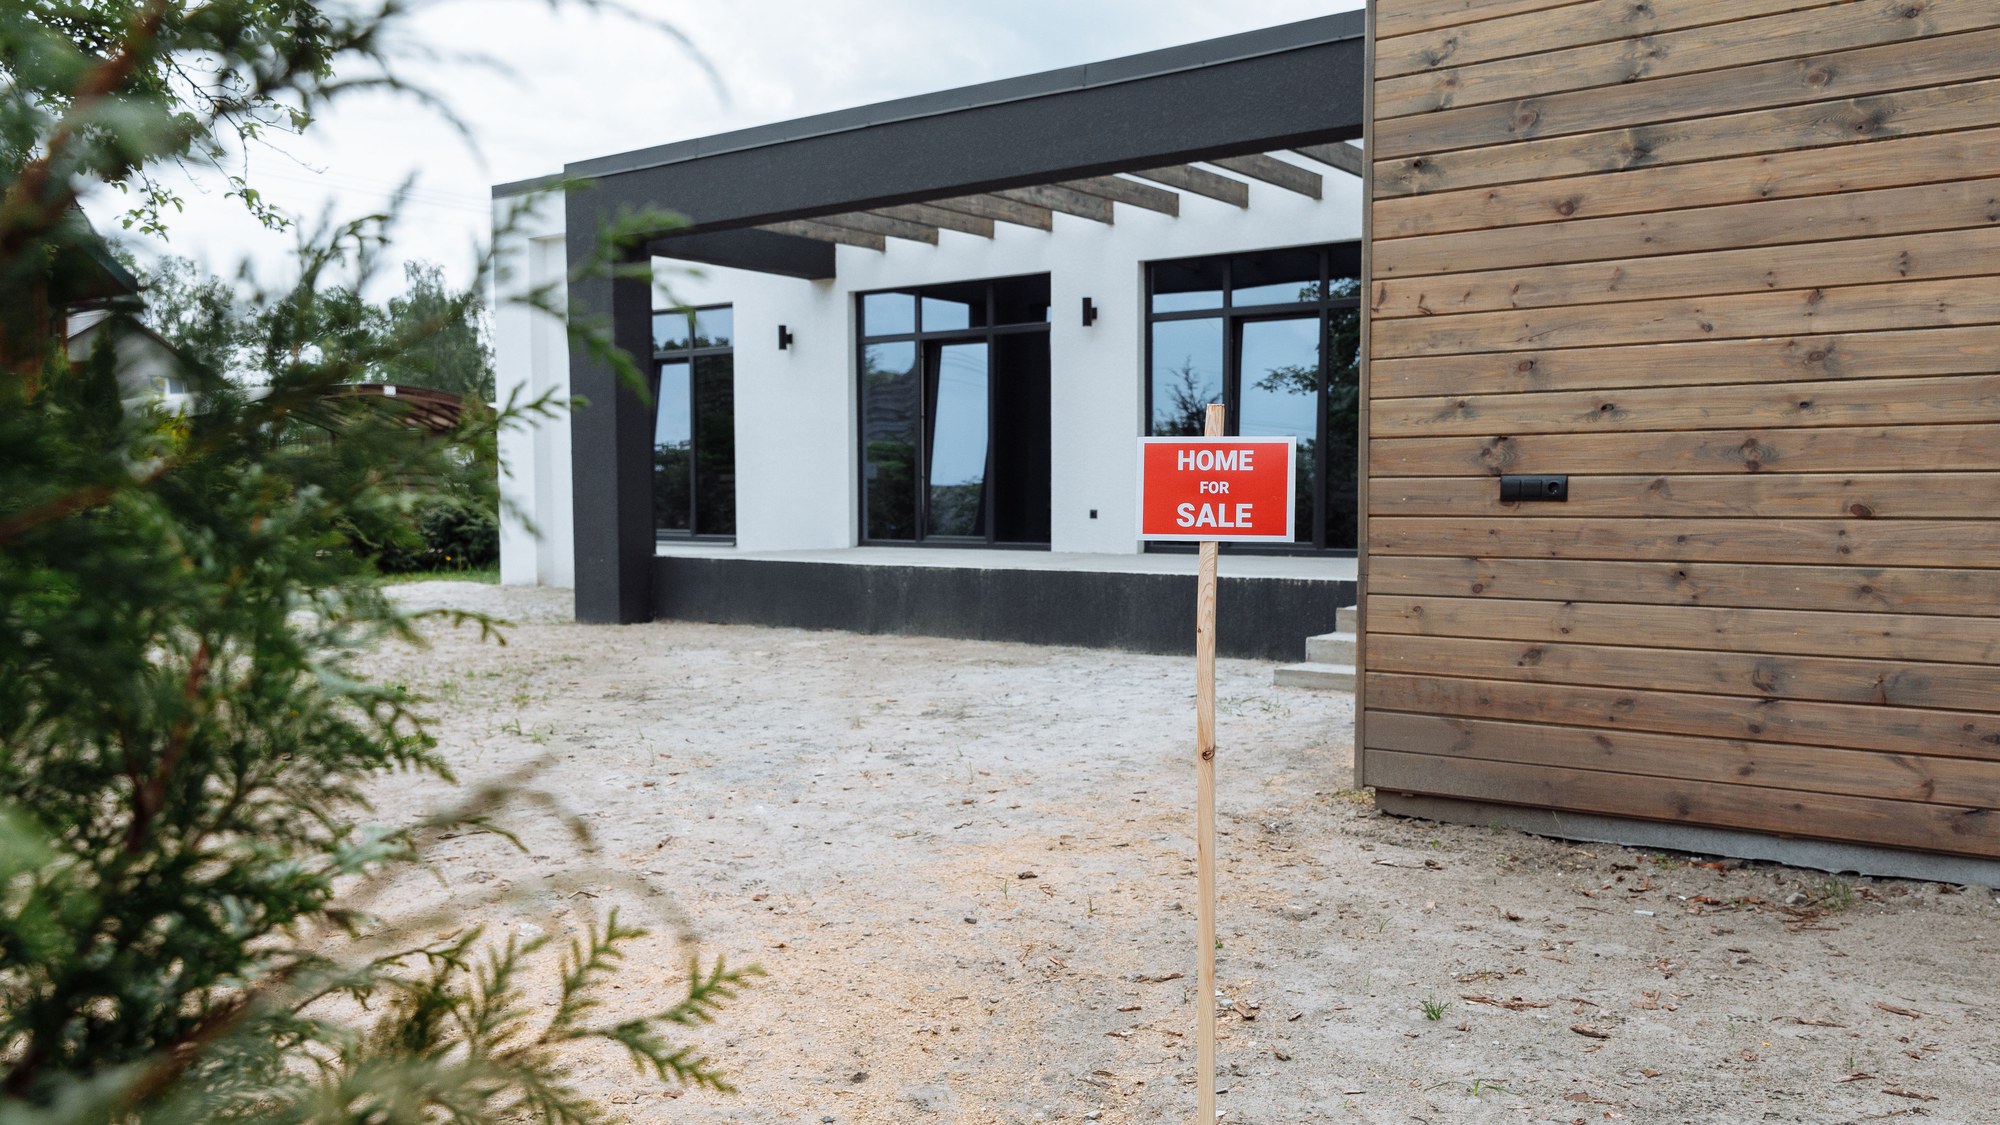
Builder confidence fell three points to 29 in October, the lowest reading since June 2012, according to the National Association of Home Builders. The same survey found 43% of builders cut prices, the highest share in NAHB’s 2020-2026 data. The average cut was 6%.
A 14-year low for builder sentiment
The NAHB/Wells Fargo Housing Market Index, published by the builders’ trade group, measures how builders rate conditions for new single-family homes. October’s 29 is down 3 points from September. It is a sentiment reading, not a price or a count of homes sold.
Each piece of the index fell. Current sales conditions dropped 2 points to 33, and sales expectations for the next six months dropped 5 points to 32. Prospective buyer traffic fell 5 points to 18, which NAHB says is the lowest since April 2012 when the pandemic-hit April 2020 reading is excluded.
For anyone shopping for a new home, the sharpest numbers are the pricing ones. NAHB says 43% of builders cut prices in October and 65% used sales incentives, the 19th straight month in which at least 60% of builders have done so.
Retirement deadlines, in your inbox: Miss an enrollment or claim deadline and the money can be gone. The Retirement Money Brief keeps you ahead of the ones that matter, every weekday.
Get the Retirement Money Brief →
We may earn a commission from links on this page.
How wide the price cuts are
NAHB’s own series runs from 2020 through 2026, and 43% is the highest share of builders cutting prices anywhere in it. That covers the entire decade so far. NAHB reports the share of builders cutting, so the milestone is about breadth, with more builders cutting than at any point in the series.
Depth is a different story. The average cut was 6%, unchanged for the seventh consecutive month. More builders are lowering prices, but the typical cut has held at 6% for seven months running, so the shift is in how many builders cut, not how deeply.
Incentives run alongside the cuts. The 65% of builders using them has stayed at or above 60% for 19 months in a row. For scale, an illustrative 6% cut on a $400,000 new home would be $24,000. NAHB’s survey does not say what the incentives are worth.
Taken together, the two measures describe a buyer who can often negotiate. Two of every five builders cut their prices, and about two of every three add incentives. Which builders do either, and in which price ranges, is not broken out in the survey, so the figures describe the industry rather than any one community.
Mortgage rates, costs and labor behind the slide
NAHB chief economist Robert Dietz wrote the group’s October 19 analysis, titled “Builder Sentiment Falls on Rising Rates.” It ties the drop to rising mortgage rates, energy and material costs, and worsening labor and lot conditions. The analysis says mortgage rates “have climbed well above 7% in recent weeks.”
Labor is a separate pressure. More than one-third of builders reported immigration enforcement activity in their markets in the past month, NAHB says, with the activity causing construction delays and discouraging legal workers from reporting to work.
Regional readings, three-month moving averages, show where it is worst. The Midwest is highest at 40, down 3 points. The Northeast is at 38, down 1, and the South is at 30, down 1. The West is lowest at 26, down 2. NAHB calls the Midwest a relative bright spot, with single-family permits up 2.9%.
That mix of falling confidence and slipping single-family permits is what builders describe in the survey. Dietz’s analysis lists affordability as the central problem, and the index component for buyer traffic, at 18, shows the least activity at new-home communities in more than a decade, apart from April 2020.
What Census data show on housing starts
The Census Bureau’s new residential construction report, released October 20, shows September housing starts at a seasonally adjusted annual rate of 1,221,000. That is 5.2% below August’s revised 1,288,000 and 7.4% below September 2025’s 1,319,000.
Single-family starts came in at 859,000, down 4.6% from a revised 900,000 in August. Single-family permits were 845,000, down 4.0% from 880,000. Total permits were 1,400,000, down 0.2% from August and 3.0% below September 2025.
Single-family completions were 840,000, down 2.4% from a revised 861,000 in August. Buildings with five or more units show permits of 503,000, starts of 349,000 and completions of 339,000. Census reports all of these as seasonally adjusted annual rates, which smooth out the usual swings by month.
Completions rose 2.2% from August to 1,192,000 but were down 14.0% from a year earlier. Census says only the year-over-year drop in completions is statistically significant, and the change in starts could be noise. It adds that confirming a trend can take three months for permits and six months for starts.
The next Census report, due November 18, covers October. Census publishes the full series on its new residential construction page, and NAHB’s November index will show whether the 43% price-cut share holds or keeps rising.
Which programs trim household costs while housing stays tight?
Builders are cutting prices and offering incentives, yet mortgage rates above 7% keep monthly housing costs high for households. Programs that lower other bills, such as heating help and food assistance, do not apply themselves and have their own income limits.
This turns the story from builder prices to household costs. The Benefits Checklist scans 11 benefit programs, covers the 2026 income limits and includes a 50-state phone directory, with a printable application tracker that comes with the download.
Match household costs to 11 programs with the 50-state directory in this checklist →
More Financial Reading
- 21 Ways to Stretch a $2,087 Social Security Check
- 15 Places to Find Your Share of the $4.25 Billion States Give Back
- 15 Ways Out of 22% Credit Card Interest
This article was produced with AI assistance and edited for accuracy against the sources linked above.