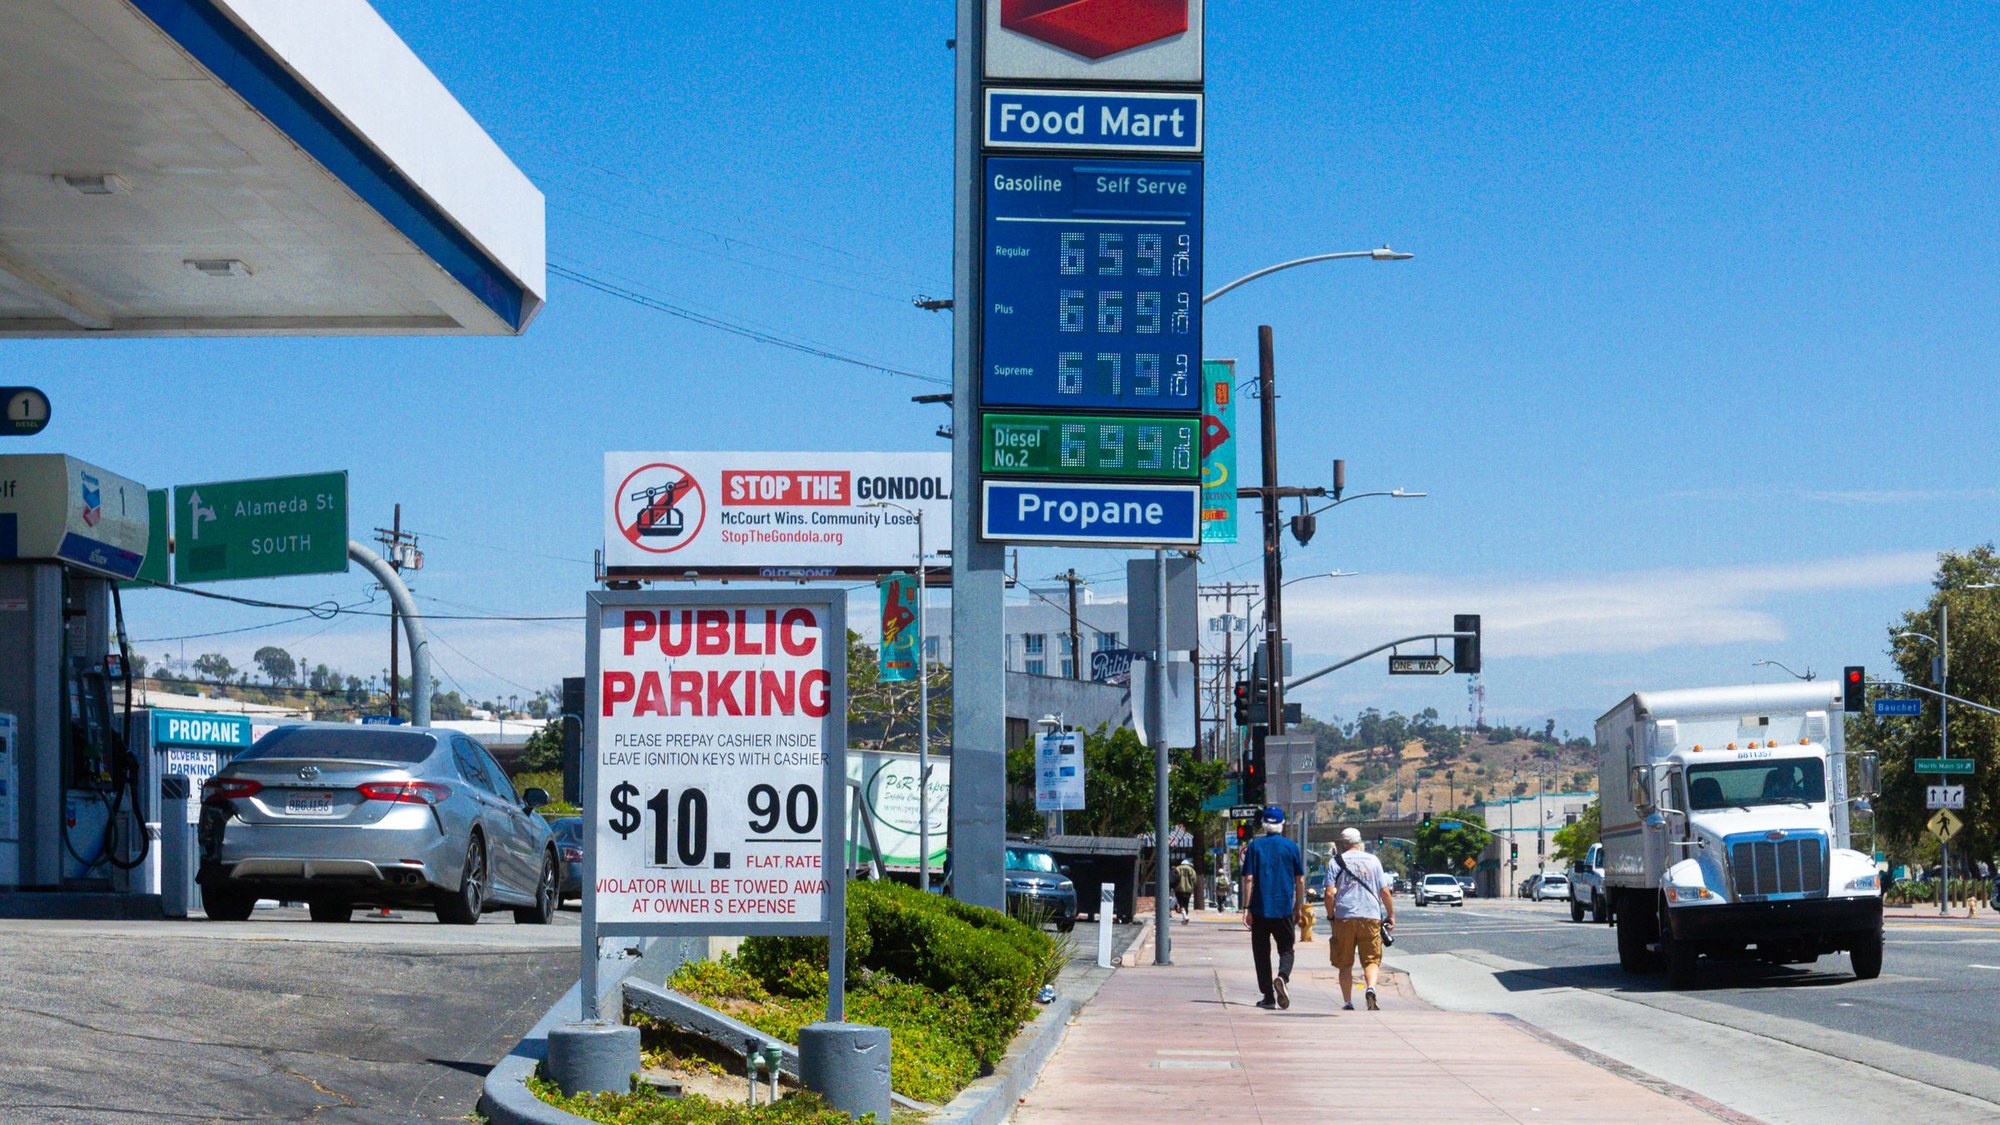
A gallon of regular costs $2.26 more in California than in Texas. California drivers paid $5.888 a gallon in the week to Oct. 26, the highest of any state in the U.S. Energy Information Administration’s weekly survey, while Texas drivers paid $3.632, the lowest. The U.S. average was $4.269.
California’s price was $1.62 above the national figure and about $1.02 above the rest of the West Coast, which averaged $4.868. On a 15-gallon fill-up, the gap to Texas comes to about $34. Los Angeles, at $5.883 a gallon, and San Francisco, at $5.856, were the priciest of the EIA’s selected cities.
For a California household on a fixed income, the question is not whether gas is expensive but whether the monthly budget can absorb a number that sits far above what most Americans pay. The answer depends on how many miles the household drives and how much cash is on hand to cover the difference.
Retirement deadlines, in your inbox: Miss an enrollment or claim deadline and the money can be gone. Join the Retirement Money Brief and we’ll send you our 2026 Government Check Reality Tracker as a welcome gift.
Get the Brief + the check tracker →
We may earn a commission from links on this page.
The EIA released the figures on Oct. 27, and its next weekly update is due Nov. 3. Because the survey is a snapshot of prices on Monday, the Oct. 26 number does not capture any move in the days since, which is why the AAA daily figures below are useful for checking direction.
California’s price is easing, slowly
Slowly. The EIA’s California figure dropped 14.3 cents in a week, from $6.031 on Oct. 19 to $5.888 on Oct. 26. AAA’s separate daily survey put the state average at $5.9109 on Oct. 31, down from $5.9263 the day before and $6.0329 a week earlier.
The month-long view is better: AAA had California at $6.3905 a month ago. But the year-ago figure, $4.6198, shows how far the price still sits above last fall, a rise of about $1.29 on AAA’s numbers. EIA’s table shows California up $1.530 from a year earlier as of Oct. 26. The two surveys differ in dates and method, which is why the figures do not match.
Where within California does the price run highest?
AAA’s page lists San Luis Obispo-Atascadero-Paso Robles as the most expensive metro at $6.1407, with Bakersfield next at $6.0796. The cheapest metro it lists is Yuba City at $5.5809. Even Yuba City, the cheapest metro on that list, is well above the $4.1837 national average AAA reported for Oct. 31.
Hawaii, at $5.6646, is the highest of the ten states on AAA’s national page, and it sits below California’s $5.9109 on the same day. California stays the most expensive state in both surveys.
The EIA’s selected-city list shows the same split between coasts and the middle of the country: Seattle $5.424, Chicago $4.897, Denver $4.407, New York City $4.178, Boston $4.176, Miami $4.077 and Houston $3.681. Only Los Angeles and San Francisco top $5.80.
The fastest climb is not in California
No. Compared with a year ago, California is up $1.530 a gallon, but Colorado is up $1.661. Colorado also jumped 18.4 cents in the latest week, to $4.458, and Ohio rose 33.1 cents to $4.380. The EIA’s Midwest region gained 12.4 cents.
So the national picture is a patchwork. The West Coast is the most expensive region at $5.417 and eased 14 cents, while the Midwest, Colorado and Ohio moved the other way. Washington, at $5.203, fell 12.9 cents on the week.
Diesel runs $8.155 in California
The EIA put on-highway diesel in California at $8.155 a gallon, the highest of any state it reports and well above the U.S. average of $6.352. AAA’s California average for diesel was $8.3674 on Oct. 31.
The EIA’s latest Short-Term Energy Outlook expects Brent crude to average $105 a barrel in the fourth quarter, and assumes Middle East oil flows stay constrained through year-end. It expects regular gasoline to average $3.91 for 2026 and $3.56 in 2027, a national forecast that does not break out California.
Is a $5.888 gallon already built into your monthly budget?
A household that pays California’s price spends about $24 more on every 15-gallon fill-up than the national average would cost. If that gap lands on a fixed income, cash sitting in an account that earns almost nothing has to cover it.
“Make Your Savings Pay You” is an 11-page guide that covers high-yield savings for the cushion you might need this year and I bonds whose rate adjusts with inflation every six months. It also includes a ladder to copy, so money comes due on a schedule that matches the bills it has to cover.
Get the savings guide with the copy-ready ladder for covering high fuel costs →
This article was produced with AI assistance and edited for accuracy against the sources linked above.