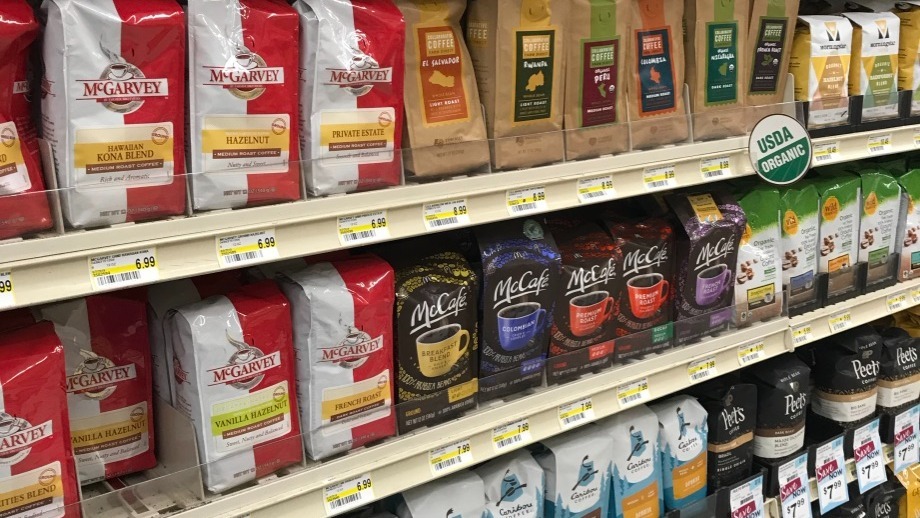
American grocery shoppers are paying more than double what they spent on ground coffee just six years ago. The average price for a pound of 100 percent ground roast coffee has reached $9.46, a 123 percent increase from the $4.174 recorded in January 2020. That jump, tracked through the Bureau of Labor Statistics’ consumer price index program, places coffee among the sharpest food-at-home price increases of the post-pandemic period and raises hard questions about where the extra cost is landing along the supply chain.
Retail coffee prices versus Brazilian harvest output
The BLS defines the tracked product as “Coffee, 100 percent, ground roast, all sizes, per lb.” and constructs the national average from labor department data gathered through urban-area price sampling across U.S. cities. The January 2020 baseline of $4.174 comes from the same series, formally designated APU0000717311, which the Federal Reserve Bank of St. Louis distributes through its FRED platform. That baseline makes the math straightforward: at $9.46, the price has grown by roughly $5.29 per pound in about six years.
Brazil, the world’s largest coffee producer, has not reported a proportional collapse in output. The Brazilian Institute of Geography and Statistics published a 2026 national harvest estimate of 344.1 million units covering both arabica and canephora (robusta) varieties. That figure signals continued large-scale production from key growing regions, including Minas Gerais. If supply from the top producing nation remains at scale, the retail price surge cannot be explained by harvest shortfalls alone.
Weather shocks, shipping disruptions, and currency swings have all affected green coffee markets since 2020, but none show a one-to-one match with the doubling of U.S. supermarket prices. Futures prices for arabica and robusta have been volatile, yet spot-market spikes tend to be temporary. By contrast, the BLS average-price series for ground roast coffee shows a sustained upward shift, suggesting that once higher prices were established at the shelf, they largely stuck even as some upstream pressures eased.
Where the 123 percent increase is actually accumulating
The gap between farm-gate volumes and checkout prices points toward domestic costs layered on after raw beans leave the port. The BLS tracks a separate Producer Price Index for roasted coffee (series WPU02630104), which captures what roasters charge before the product reaches store shelves. Comparing the retail average-price series with the producer index over time can reveal whether roasting, packaging, and distribution margins have widened faster than the commodity input itself. Available FRED data confirm the retail series has climbed steeply since 2022, but no published BLS explanatory note isolates how much of the $9.46 reflects raw bean costs versus processing and logistics markups.
What is clear is the scale of the change. The FRED chart for the coffee price series shows a relatively flat trend through the late 2010s, followed by a sharp rise beginning in 2021 that never fully reversed. In inflation-adjusted terms, some of that increase reflects broader price levels across the economy. Yet even after accounting for general inflation, a doubling of the sticker price for a staple pantry item stands out. The structure of the coffee market-dominated by a handful of multinational roasters and major grocery chains-means that small shifts in their pricing strategies can ripple quickly through household budgets.
The May 2026 CPI news release includes a specific line item for “roasted coffee,” placing the category inside broader food-at-home inflation data. That context matters for household budgets: coffee is a near-daily purchase for tens of millions of Americans, and a 123 percent price increase compounds across weeks and months in ways that a single grocery receipt can obscure. A household buying one pound per week now spends roughly $275 more per year on coffee than it did at the start of 2020, based on the historical price series and the current $9.46 average.
Those extra dollars do not vanish; they are redistributed along the supply chain. Some portion goes to cover higher wages at ports, warehouses, and retail stores, as well as increased costs for packaging materials, fuel, and insurance. Another portion likely reflects improved margins for brands and retailers that discovered consumers were willing, or at least forced, to tolerate higher prices without dramatically cutting back on at-home coffee consumption. The persistence of elevated prices despite steady Brazilian output suggests that domestic cost structures and pricing power now play a larger role in what Americans pay than the size of any single harvest.
For consumers, the options are limited but real. Trading down from premium blends to store brands, buying in bulk when promotions appear, or shifting some coffee consumption to workplace or institutional settings can soften the impact. For policymakers and researchers, the coffee case underscores why tracking detailed price data matters. Tools like the BLS average-price series for ground roast coffee, available through FRED’s database, offer a window into how global commodities, domestic logistics, and corporate pricing decisions converge into the number on a supermarket shelf. As long as that number remains near $9.46, the humble morning cup will continue to serve as a daily reminder of an inflation cycle that has yet to fully unwind.