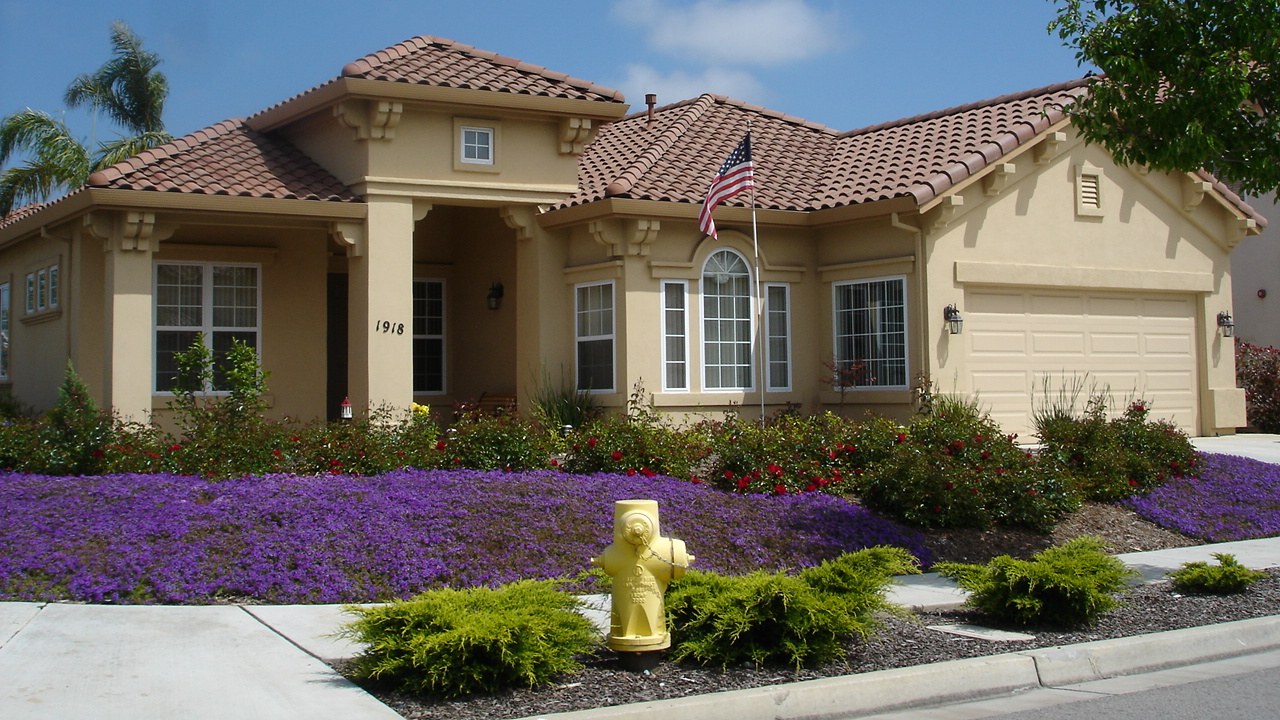
A couple starting to save for their first home today, earning the national median income and setting aside money at the average American savings rate, will not have enough for a down payment until 2033. That is the core finding of a May 2025 analysis from Realtor.com: seven years of disciplined saving to reach a typical first-time buyer’s down payment. The timeline has improved sharply from a peak of 12 years in 2022, when pandemic-era price spikes collided with a cratering savings rate. But for the millions of renters still trying to cross into homeownership as of mid-2026, seven years is long enough to delay wealth-building, reshape career decisions, and push family milestones further down the calendar.
The same analysis found that first-time buyers are now putting down a median 10% of the purchase price, the largest share in nearly four decades. A bigger upfront commitment can mean lower monthly payments and better loan terms, but it also raises the savings bar at a moment when home prices in most markets remain well above pre-pandemic levels.
Where the numbers come from
Realtor.com built its estimate on three inputs: the personal saving rate published monthly by the U.S. Bureau of Economic Analysis, median household income data, and median down payment dollar amounts drawn from listing and transaction records. The model asks a straightforward question: if a household earning the national median income saved at the prevailing national rate, how many months would it need to accumulate a typical first-time buyer’s down payment?
The BEA saving rate is the strongest link in that chain. It is an official government statistic with decades of history, updated regularly, and widely cited by economists. The other two inputs rely on Realtor.com’s proprietary data, which means the seven-year figure is a modeled projection rather than a direct count of how long actual buyers saved. That distinction matters: the estimate works well as a benchmark, but individual timelines will vary widely based on income, location, debt load, and spending patterns.
Why the timeline shrank from 12 years to 7
Two forces drove the improvement. Wage growth outpaced home price appreciation in several quarters between 2023 and early 2025, narrowing the gap between what households earned and what entry-level homes cost. At the same time, the personal saving rate stabilized after dropping sharply during the high-inflation months of 2022, when rising grocery, gas, and rent costs ate into discretionary income. Together, those shifts meant each month of saving covered a larger slice of the required down payment.
Even so, seven years is far longer than the pre-pandemic norm. Before 2020, National Association of Realtors survey data showed first-time buyers typically saving for a median of about two to three years, often supplemented by gifts or windfalls. And the recent improvement is fragile. A renewed climb in mortgage rates, a slowdown in hiring, or another leg up in home prices could stretch the timeline back out quickly.
The 10% down payment in context
Realtor.com’s finding that first-time buyers are putting down a median 10% aligns with a broader trend tracked by NAR, whose most recent buyer survey showed first-time purchasers steadily increasing their down payment shares over the past decade. On the current national median-priced existing home, which NAR pegged near $420,000 in its most recent reporting period, 10% works out to roughly $42,000. That sum explains why the savings timeline stretches into years rather than months.
But 10% is far from the only option. FHA-backed loans allow down payments as low as 3.5% for qualified borrowers, and some conventional programs accept 3% to 5%. Veterans and active-duty service members may qualify for VA loans with no down payment at all, and USDA-backed loans offer a similar zero-down path for buyers in eligible rural and suburban areas. Choosing a smaller down payment shortens the saving period but typically adds private mortgage insurance to the monthly bill (or, in the case of FHA loans, a mortgage insurance premium), raising the total cost of the loan over time. Buyers weighing that tradeoff should compare the monthly insurance cost against the opportunity cost of several more years of renting while they save for a larger down payment.
What the national average obscures
A seven-year national benchmark smooths over enormous regional differences. In markets like San Jose, San Francisco, and New York, where median home prices run two to three times the national figure, the savings timeline for a 10% down payment can stretch well beyond a decade on a local median income. In more affordable metros across the Midwest and parts of the South, the math can work in three to five years.
The aggregate BEA saving rate also masks who is actually saving. Younger renters, the group most likely to be first-time buyers, tend to earn less than the national median household income and often carry student loan balances that compete with housing savings. Federal Reserve Survey of Consumer Finances data shows that households headed by adults under 35 have significantly lower net worth and saving capacity than older cohorts. For these buyers, the effective timeline may be longer than seven years unless supplemented by family gifts, employer benefits, or down payment assistance programs.
Those assistance programs deserve more attention than they usually get. According to Down Payment Resource, a national database, more than 2,000 homebuyer assistance programs operate across the country, offered by state housing finance agencies, local governments, and nonprofits. Many provide grants or forgivable loans covering part or all of a down payment for income-qualified buyers. Yet awareness remains low: NAR surveys consistently find that a large share of renters do not know these programs exist.
Practical steps for buyers running their own numbers
Rather than anchoring to the national estimate, prospective buyers can build a more accurate personal timeline in a few steps:
- Pin down your target price range. Look at recent sale prices for the type of home you would actually buy in the neighborhoods you are considering, not national medians.
- Choose a down payment percentage. Decide whether you are aiming for 10%, which avoids some PMI costs on conventional loans, or a lower threshold like 3.5% through FHA, which gets you into the market sooner but raises monthly costs. If you are a veteran or buying in a rural area, explore zero-down options first.
- Check for assistance programs. Search your state housing finance agency’s website and Down Payment Resource before assuming you need to save the full amount on your own.
- Calculate your monthly saving capacity. Subtract taxes, debt payments, rent, and essential living costs from your take-home pay. The remainder is what you can realistically direct toward a housing fund each month.
- Divide and stress-test. Divide your target down payment by your monthly saving amount to get a baseline timeline. Then run the math again assuming a 5% annual increase in home prices to see how a rising target changes the picture.
That exercise often reveals which lever matters most. For some households, boosting income through a job change or side work compresses the timeline more than any spending cut. For others, expanding the geographic search to a less expensive market shaves years off the clock. And for buyers in high-cost cities, the math may point toward a condo or townhouse as a realistic first purchase rather than a single-family home.
What seven years of waiting actually costs
The financial drag of a long savings period extends well beyond the down payment itself. Every year spent renting instead of owning is a year without building home equity, a form of forced savings that has historically been the single largest wealth-building tool for middle-class American families. It is also a year exposed to rent increases: Zillow’s Observed Rent Index shows national asking rents climbed roughly 30% between 2019 and 2024, eating into the very income buyers are trying to set aside.
The psychological weight is real, too. Bankrate’s housing affordability surveys consistently find that the down payment is the single biggest perceived obstacle to homeownership, outranking mortgage rates, credit scores, and closing costs. A seven-year horizon can feel abstract enough to discourage saving altogether, which is why financial planners often recommend automating transfers to a dedicated housing fund and treating the contribution like a non-negotiable bill.
The drop from 12 years to seven is genuine progress, driven by real gains in wages relative to prices. But it does not erase the core challenge: for most first-time buyers in 2026, assembling a competitive down payment remains a years-long project that demands sustained discipline, realistic expectations about what and where to buy, and a willingness to revisit the plan every time income, prices, or interest rates shift beneath it. The buyers who get there fastest will be the ones who stop treating the national average as their destiny and start treating it as a number to beat.