American households woke up to a sharper bite from rising prices on June 10, 2026, as the Consumer Price Index for All Urban Consumers climbed 4.2% over the past 12 months, the fastest annual pace in three years. The Bureau of Labor Statistics reported that the index jumped 0.5% in May alone, with a 3.9% surge in energy costs responsible for most of that monthly gain. Core prices, which strip out volatile food and energy categories, rose a more restrained 0.2% for the month and 2.9% year-over-year.
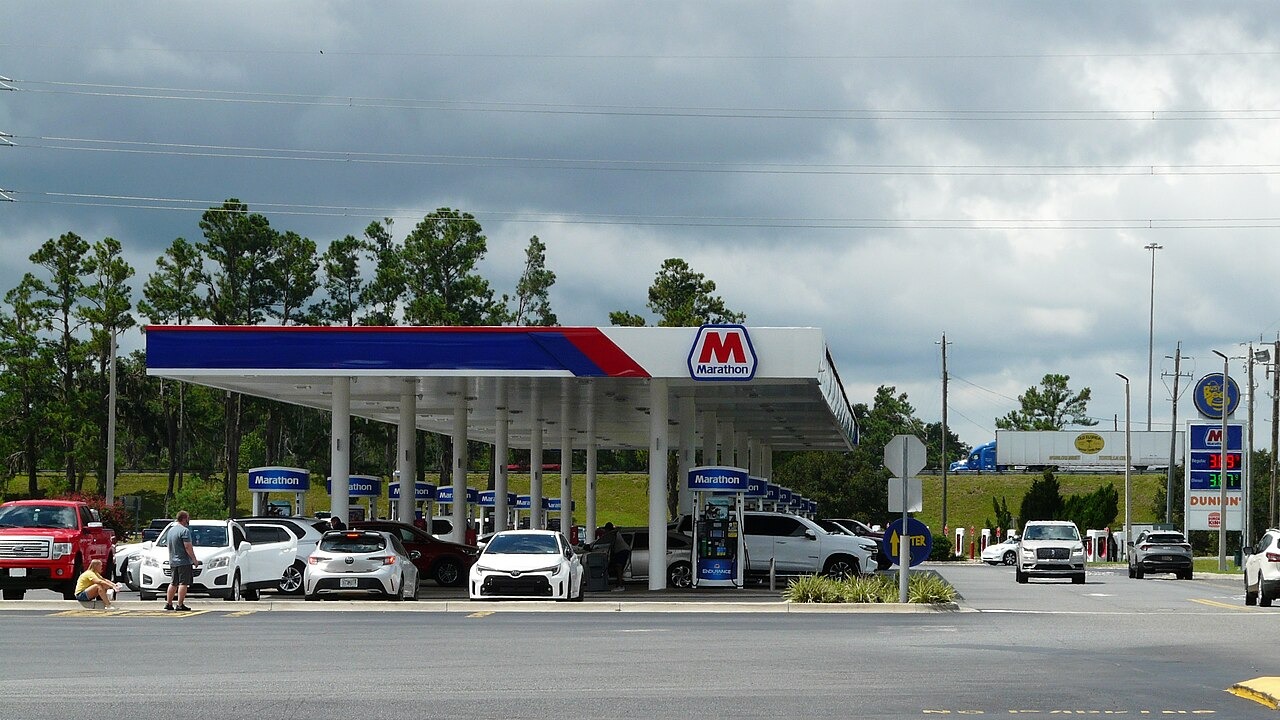
Energy costs squeeze family budgets at the worst time
The gap between headline inflation and core inflation tells a pointed story. At 4.2% year-over-year, the all-items index is running well above the 2.9% core rate, and the difference traces almost entirely to energy. A 3.9% single-month jump in the energy index means gasoline, electricity, and natural gas bills all rose faster than wages for millions of workers whose pay adjustments have not kept pace.
That squeeze matters right now because it lands at the start of summer, when driving season and air-conditioning demand typically push energy consumption higher. If prices stay elevated, the added cost acts like a tax on discretionary spending. Families paying more at the pump and on utility bills have less left over for restaurants, travel, and retail purchases. Census Bureau retail sales data, due in the coming weeks, will offer the first hard signal of whether consumers are already pulling back. The hypothesis is straightforward: a sharp, energy-driven price spike should show up as softer discretionary spending within roughly 60 days, and the July and August retail reports will be the test.
What the BLS data show, line by line
The primary release, designated USDL-26-0824, was published at 8:30 a.m. ET on June 10. It confirmed that the annual rate accelerated from 3.8% in April to 4.2% in May, a jump of four-tenths of a percentage point in a single month. Energy drove most of the increase: the 3.9% monthly energy surge dwarfed the 0.2% rise in core prices, which exclude food and energy. That core reading suggests underlying price pressures remain relatively contained, but the headline number is what consumers feel at the register and at the gas station.
The 4.2% annual rate is the highest since mid-2023, when inflation was still cooling from its post-pandemic peak. Reaching that level again after nearly three years of gradual decline raises a direct question for the Federal Reserve: does this represent a temporary energy shock or the beginning of a broader re-acceleration? The core rate offers some reassurance on that front, but policymakers will need several more months of data before drawing firm conclusions.
Another detail in the May report is the divergence between goods and services. Price increases for many physical goods, from appliances to used cars, continued to moderate after the supply-chain snarls of earlier years. By contrast, services such as insurance, medical care, and shelter remained comparatively firm, even if their month-to-month gains were smaller than last year. For households, that means the big recurring bills tied to where they live and how they get to work are not falling, even as some store-bought items stabilize.
Gaps in the data and what to watch by mid-July
Several pieces of the puzzle are still missing. The BLS release provides national aggregates but does not break out how unevenly the energy spike hit different regions. States that depend heavily on natural gas for summer cooling or that have higher gasoline taxes may be absorbing a disproportionate share of the burden, while areas with milder weather or more mass transit may be somewhat shielded. Regional CPI reports, which arrive later in June, will help clarify where the pain is most acute.
Another open question is how businesses respond. Some retailers and service providers may choose to absorb part of their higher fuel and utility costs to avoid scaring off customers, especially in competitive markets. Others, particularly small firms with thin margins, may have little choice but to pass the increase through. Analysts will be watching corporate earnings calls for clues about how much pricing power companies believe they still have, and whether they expect the May energy shock to persist.
Labor-market dynamics will also shape how the latest inflation reading feeds through to household finances. If wage growth continues to slow while prices accelerate, real purchasing power will erode, reinforcing the drag from energy. On the other hand, if employers feel pressure to raise pay to retain workers in a still-tight job market, some families could keep pace with rising costs, at least temporarily. Reporting from Associated Press economic coverage has underscored how sensitive consumer sentiment has become to even modest changes in gas prices, suggesting that perceptions may worsen faster than the underlying data.
By mid-July, three indicators will be crucial. First, the next CPI release will show whether May’s 3.9% jump in energy was a one-off shock or the start of a trend. A reversal would ease pressure on the Federal Reserve and on household budgets; a second strong month would heighten concerns about a more entrenched problem. Second, retail sales figures will reveal whether discretionary spending is already softening in response to higher fuel and utility bills. Third, new readings on consumer confidence will indicate how worried households are about inflation’s direction, a factor that can itself influence spending and saving decisions.
For now, the picture is one of a fragile equilibrium: underlying inflation appears relatively stable, but a sudden spike in energy costs has pushed headline prices to their fastest pace in three years. If energy markets calm, the May data may go down as a brief scare. If they do not, the summer of 2026 could mark a turning point in the inflation story, with households once again reshuffling budgets to cover the essentials before anything else.