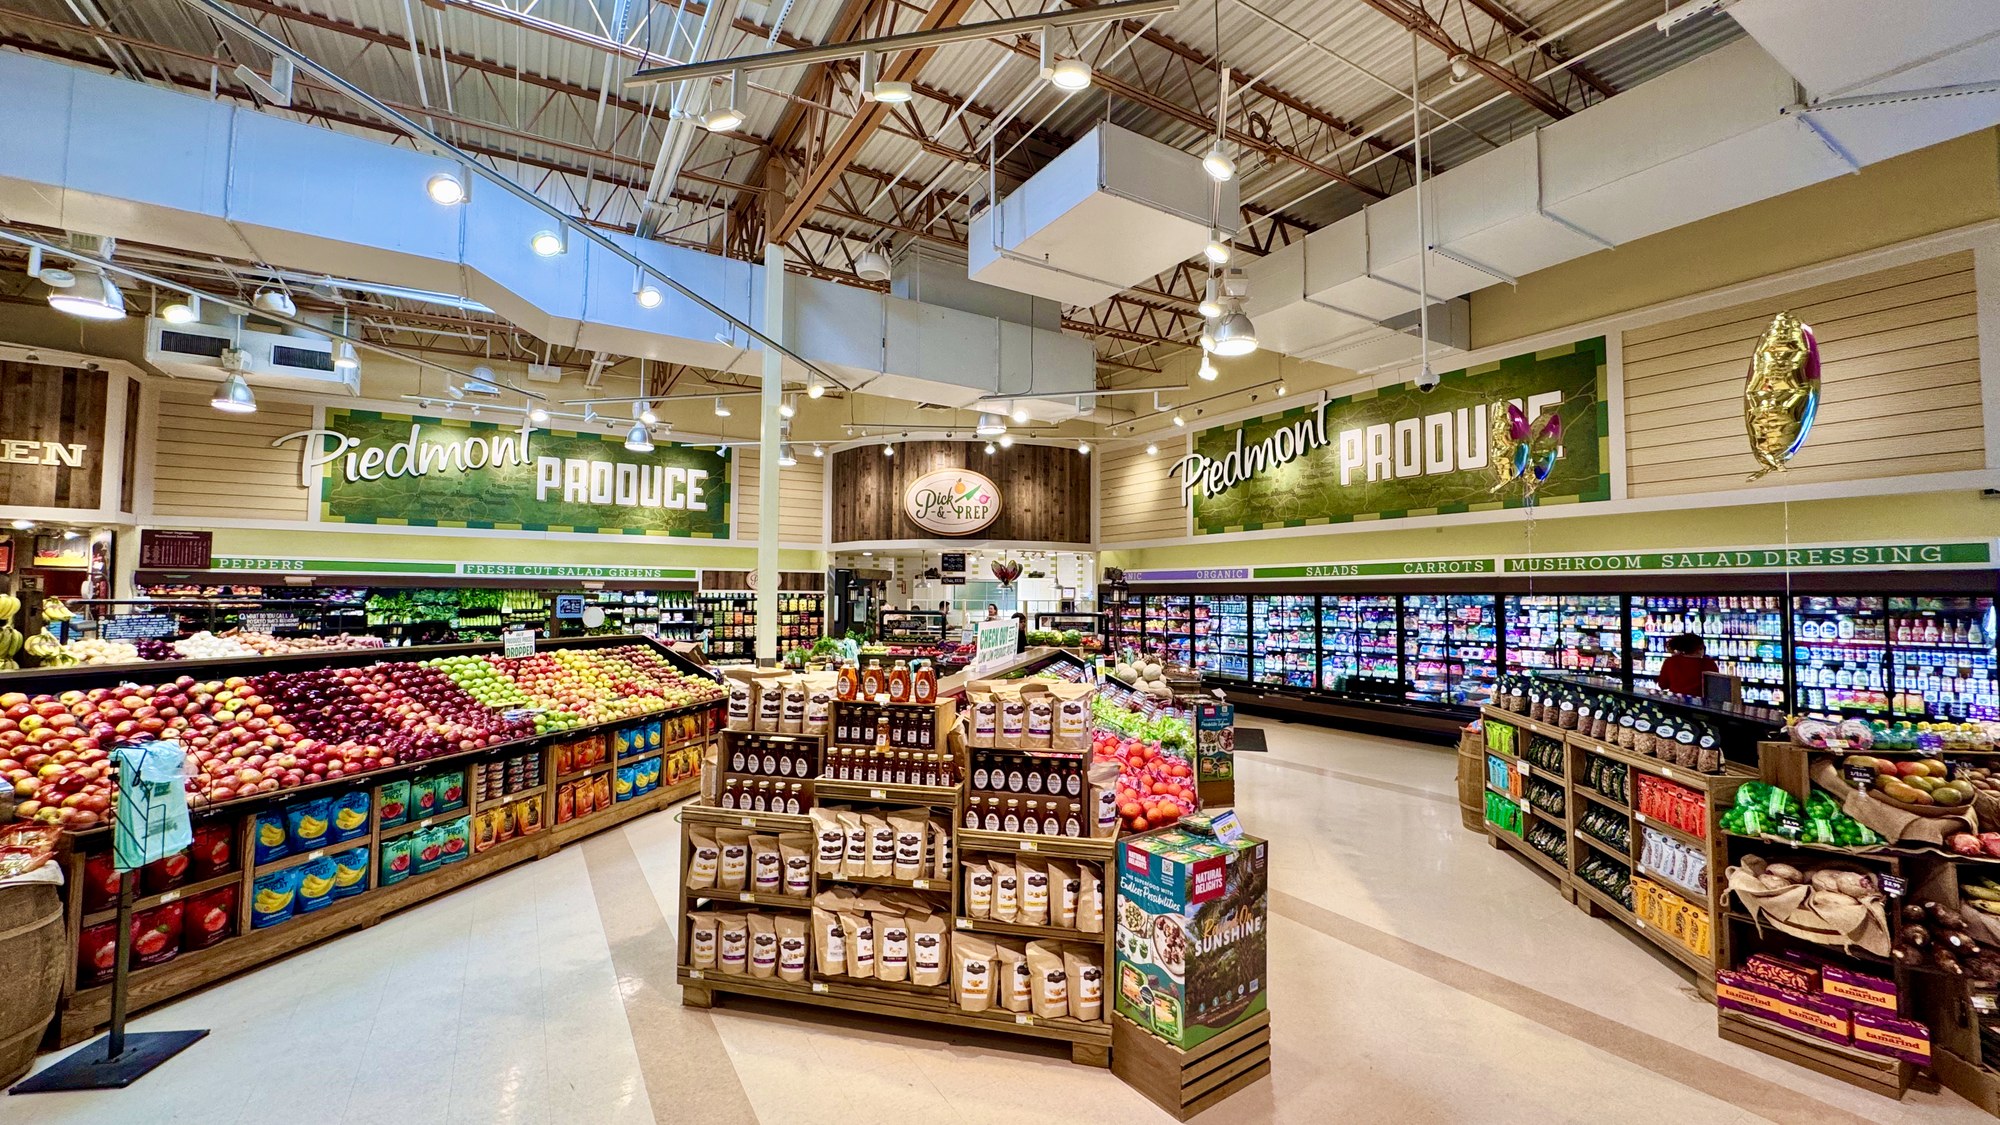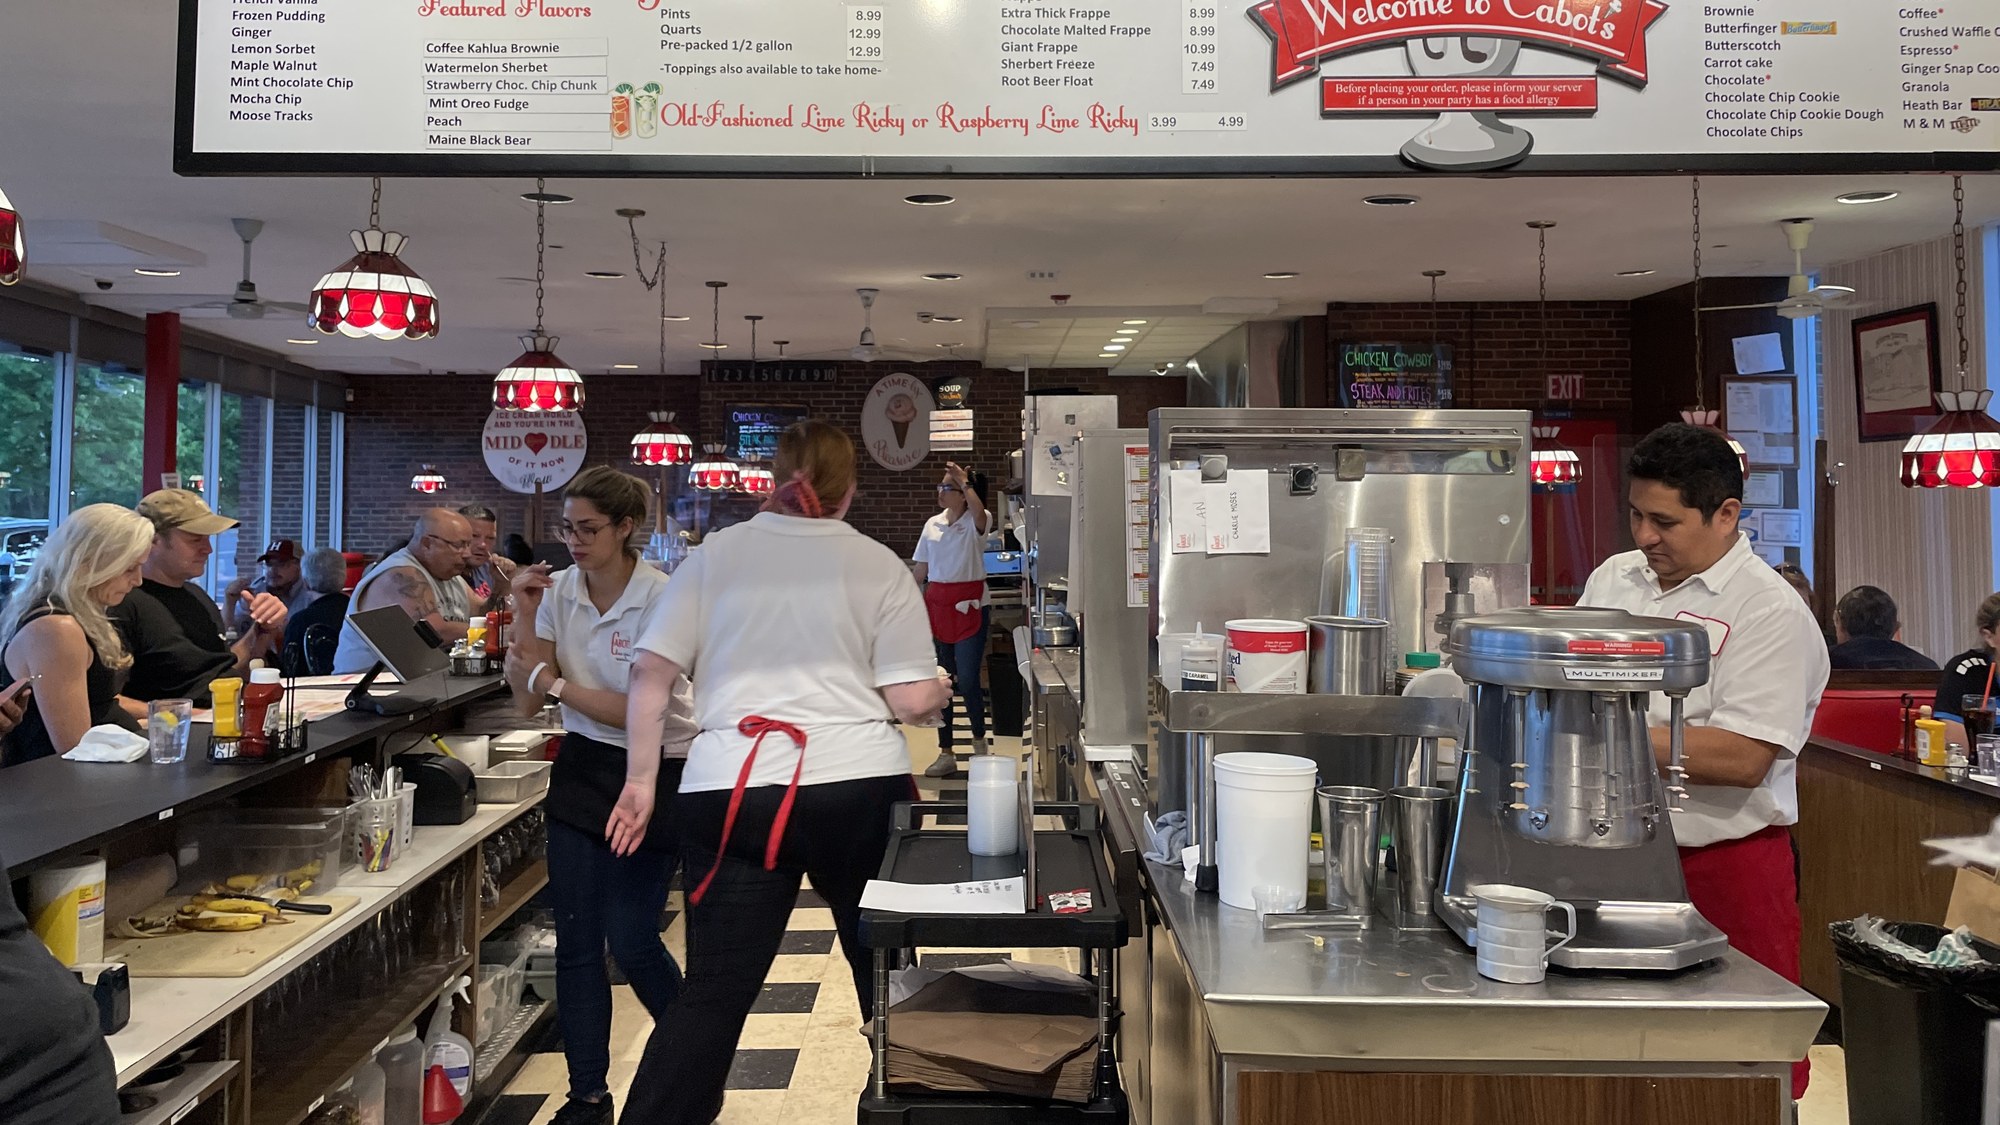
Sales at restaurants and bars rose 5.8% in August compared with a year earlier, the Census Bureau reported Sept. 16, with the category up 1.2% from July alone. The gain outpaced most other retail categories in the same monthly report, continuing a run of growth for an industry that has expanded through most of 2026. The dollar figure blends how many meals Americans bought with how much each one cost, a distinction that matters for a household watching every restaurant tab against a fixed monthly income.
Inside The Senior Property Tax & Home-Cost Relief Kit: a rising restaurant total says nothing about the property-tax bill or heating and cooling costs on the same fixed budget. The kit covers the circuit-breaker credit for renters and help with heating, cooling and home repairs. Compare the circuit-breaker credit and home-repair help →
What Census’s August Retail Report Found
The Census Bureau’s Advance Monthly Retail Trade Survey, published Sept. 16, put food services and drinking places sales up 1.2% from July and up 5.8% from August 2025. The same release tracked general merchandise stores up 0.7% for the month and 4.5% for the year, a smaller but still positive gain that suggests consumer spending broadly held up in August rather than shifting narrowly into dining out. The advance survey samples a subset of retailers and is later revised as fuller data comes in, so the bureau’s 5.8% figure is a first, not final, read on the month, one that nonetheless matched the direction of individual restaurant chains’ own results released the same week. The advance report is the first of three looks the bureau takes at each month’s retail figures, with a preliminary revision and then a final revision following in the weeks after, so the 5.8% figure that made Sept. 16 headlines could still move slightly once fuller data from a wider sample of retailers is in.
A Chain’s Own Numbers Point The Same Direction
Darden Restaurants, the parent of Olive Garden and LongHorn Steakhouse, reported total sales up 5.1% to $3.2 billion for the fiscal quarter ended Aug. 30, with LongHorn’s same-restaurant sales climbing 6.2% and Olive Garden’s rising a slower 1.1%. President and Chief Executive Rick Cardenas said the quarter was “a solid start to our fiscal year with each of our segments delivering positive same-restaurant sales,” a company-level echo of the industrywide gain Census reported for the same weeks. A single chain’s results cannot confirm a national statistic, but Darden’s own filing lines up with the broader direction Census found across the whole restaurant and bar category, and its full-year earnings guidance, reaffirmed in the same release, assumes that pace of growth continues rather than fades.
A Dollar Total Blends Higher Prices And More Visits
Census’s 5.8% figure counts dollars spent, not meals served, and it is not adjusted for inflation the way the Consumer Price Index is designed to be. A separate Bureau of Labor Statistics report, also covering August, found the price of food away from home up 3.4% over the year, meaning a meaningful share of the sales increase reflects higher menu prices rather than diners simply buying more food. Food eaten at home rose a slower 2.2% over the same year, a gap that has been pushing some households toward takeout even as the reverse math, cooking more at home, would stretch a fixed monthly budget further. The Bureau of Labor Statistics designs the Consumer Price Index specifically to strip out that kind of volume effect, tracking a fixed basket of goods and services over time so that its percentage changes reflect price alone; the Census retail survey, by contrast, is built to measure the dollar volume moving through cash registers, which is why the two reports can describe the same restaurant boom in different terms without contradicting each other.
What A National Total Doesn’t Show About Who’s Spending More
Neither the Census release nor Darden’s own results say whether the spending came disproportionately from higher-income households eating out more often, or from every income group simply paying more for the same number of meals as menu prices climbed. A household living on Social Security or a fixed pension does not automatically share in a national dining-out gain the way a two-earner household with rising wages might; its own income moves only through the Social Security Administration’s annual cost-of-living adjustment, on a schedule that has nothing to do with restaurant sales. If that household is instead cutting back on meals out to manage a fixed budget, its own spending could be falling even as the national total Census reported keeps climbing, because an industry-wide figure like 5.8% is shaped most by whichever households are spending the most, not distributed evenly across every kind of household making up the average. Census does not publish the restaurant category broken out by the age of the shopper, so there is no way to read this particular report for how much of the 5.8% gain, if any, came from households living mainly on Social Security or a pension rather than a paycheck.
Local Bills On A Different Calendar Entirely
Whether the restaurant industry’s monthly total rises or falls, a household’s own property-tax bill and utility accounts run on calendars set by local government and utility providers, not by how many Americans ate out in August. Those bills do not shrink because national restaurant spending data looked strong, and they do not wait for the next Census release to come due. A retired household managing a fixed monthly income still has to track its own property-tax and utility filing windows separately, regardless of what the broader retail numbers show in any given month. Property-tax assessments, freeze applications and utility-assistance enrollment periods are each set on their own local or state timeline, and none of them move because the restaurant industry had a strong August.
The Bills That Don’t Show Up In A Retail Report
Census’s restaurant and bar figure describes an industry’s revenue, not the property-tax bill or the heating and cooling costs already competing for space in a fixed monthly budget. Those costs are unrelated to how much the country spent eating out in August, and relief programs built for them require their own separate applications.
The Senior Property Tax & Home-Cost Relief Kit lays out the circuit-breaker credit that includes renters and separate help with heating, cooling and home repairs, alongside an application log for tracking deadlines that don’t repeat automatically.
Compare the property-tax and home-cost relief options in The Senior Property Tax & Home-Cost Relief Kit.
This article was produced with AI assistance and checked against the primary sources linked above.