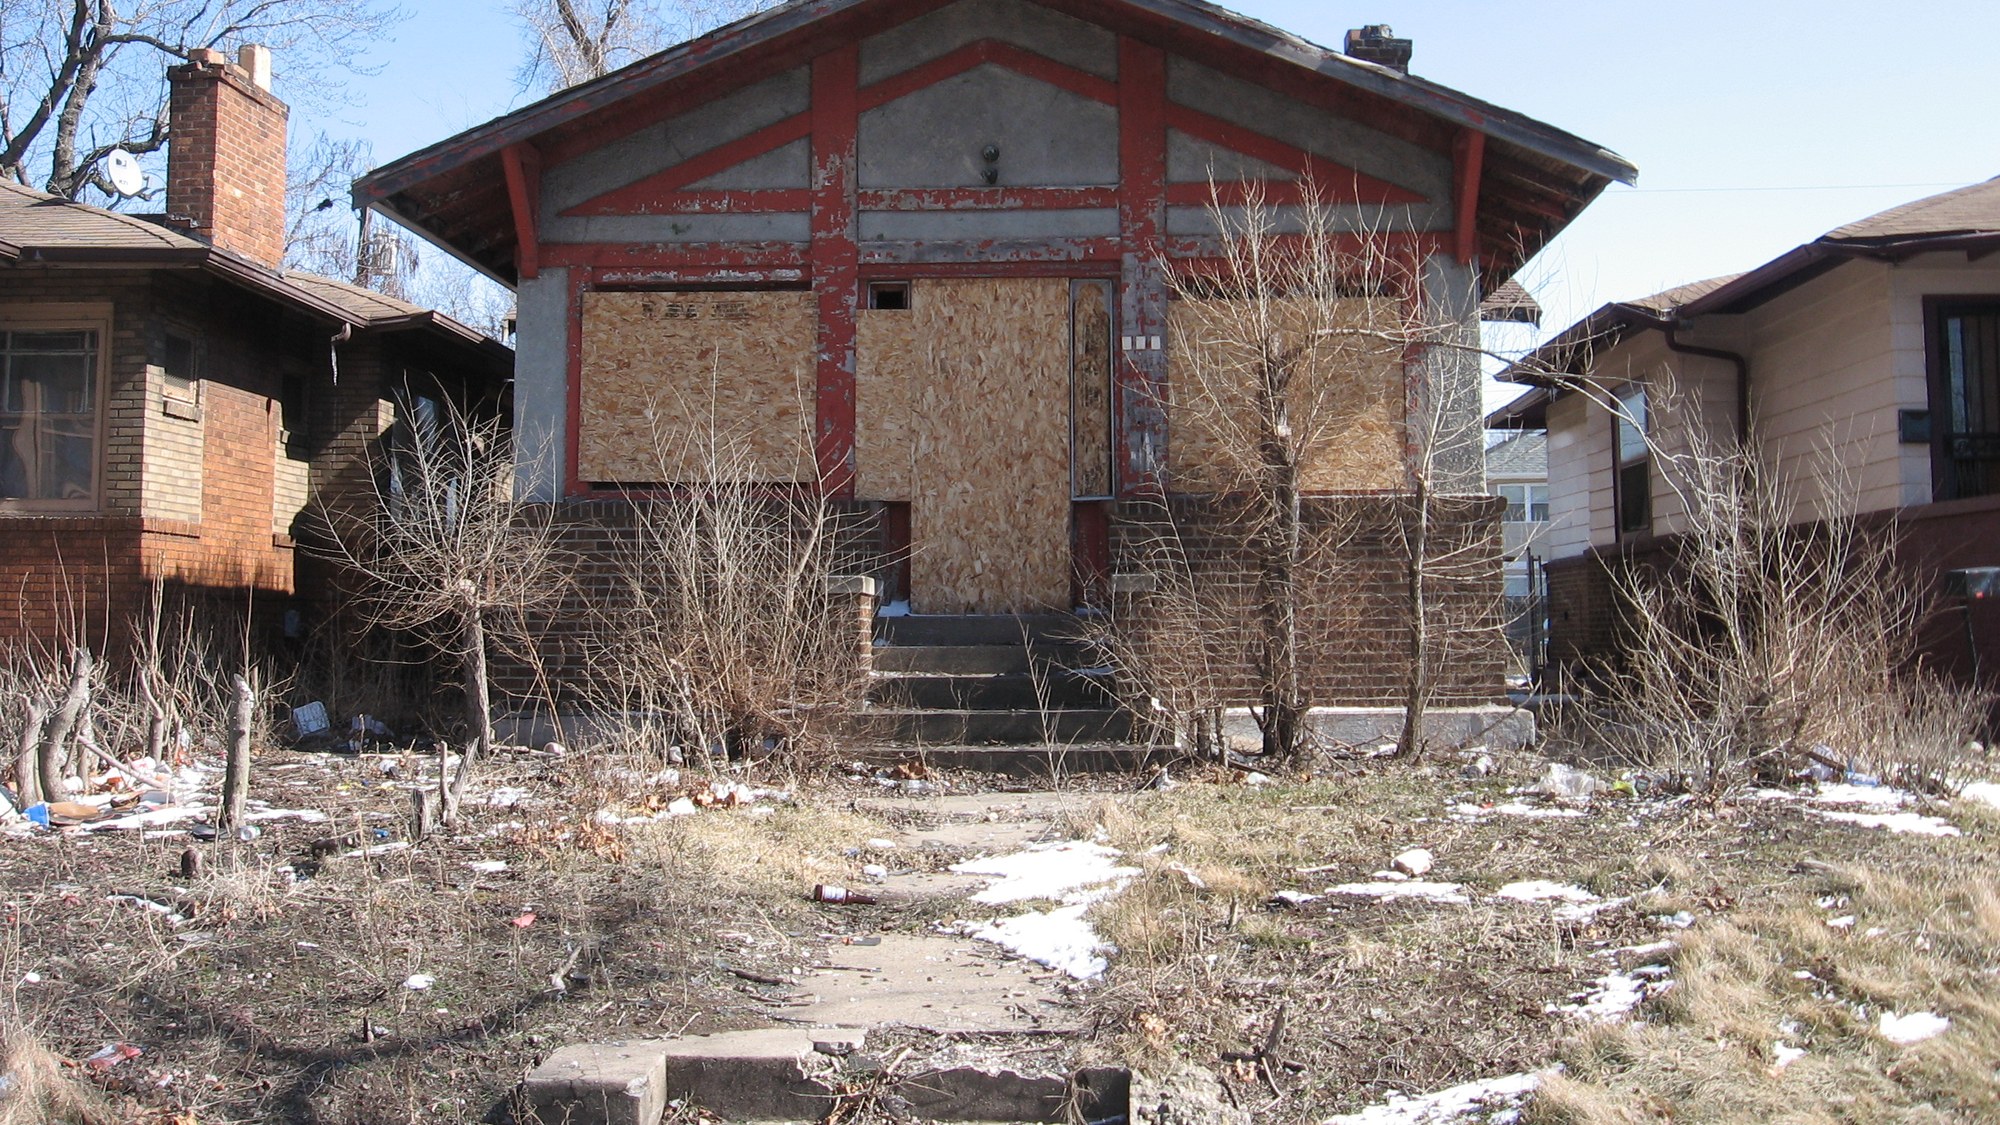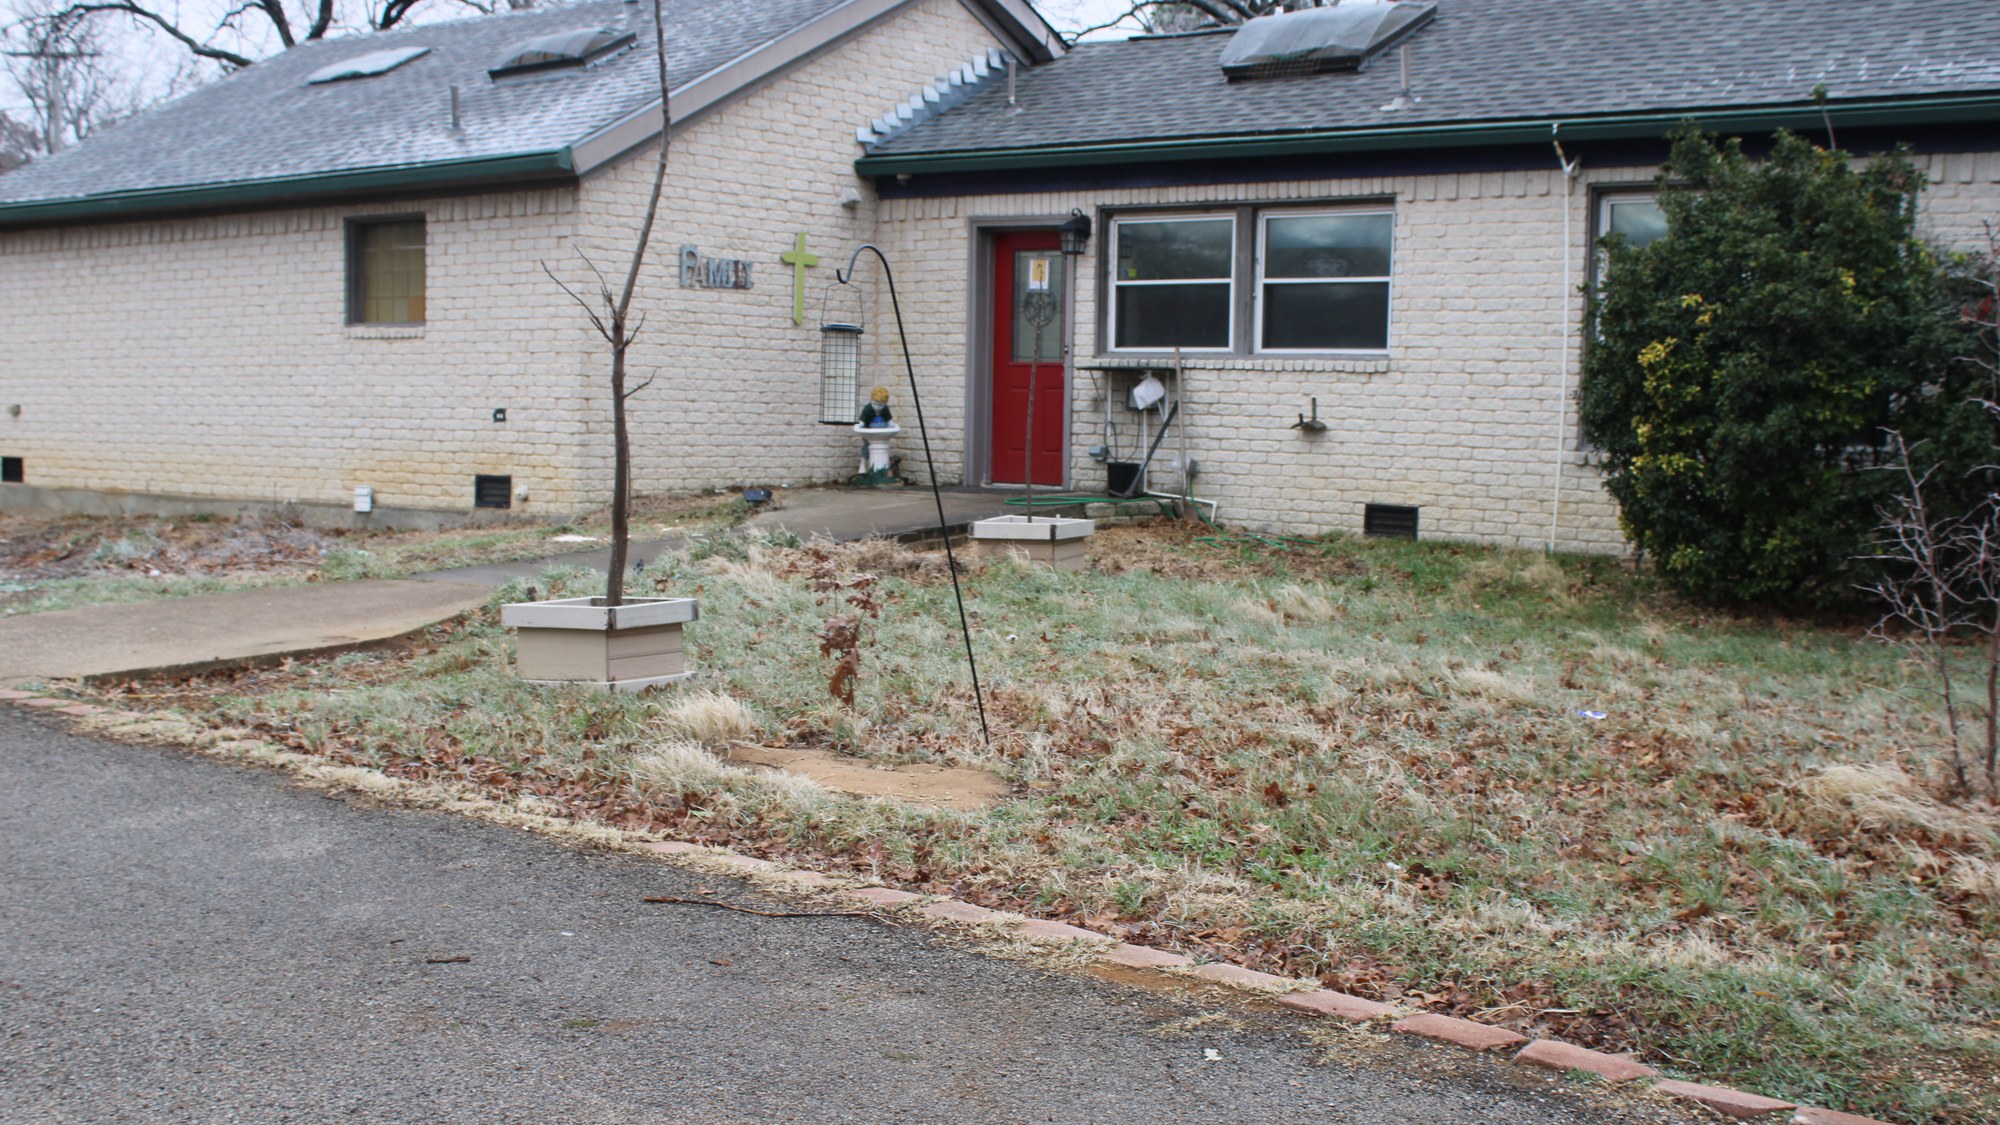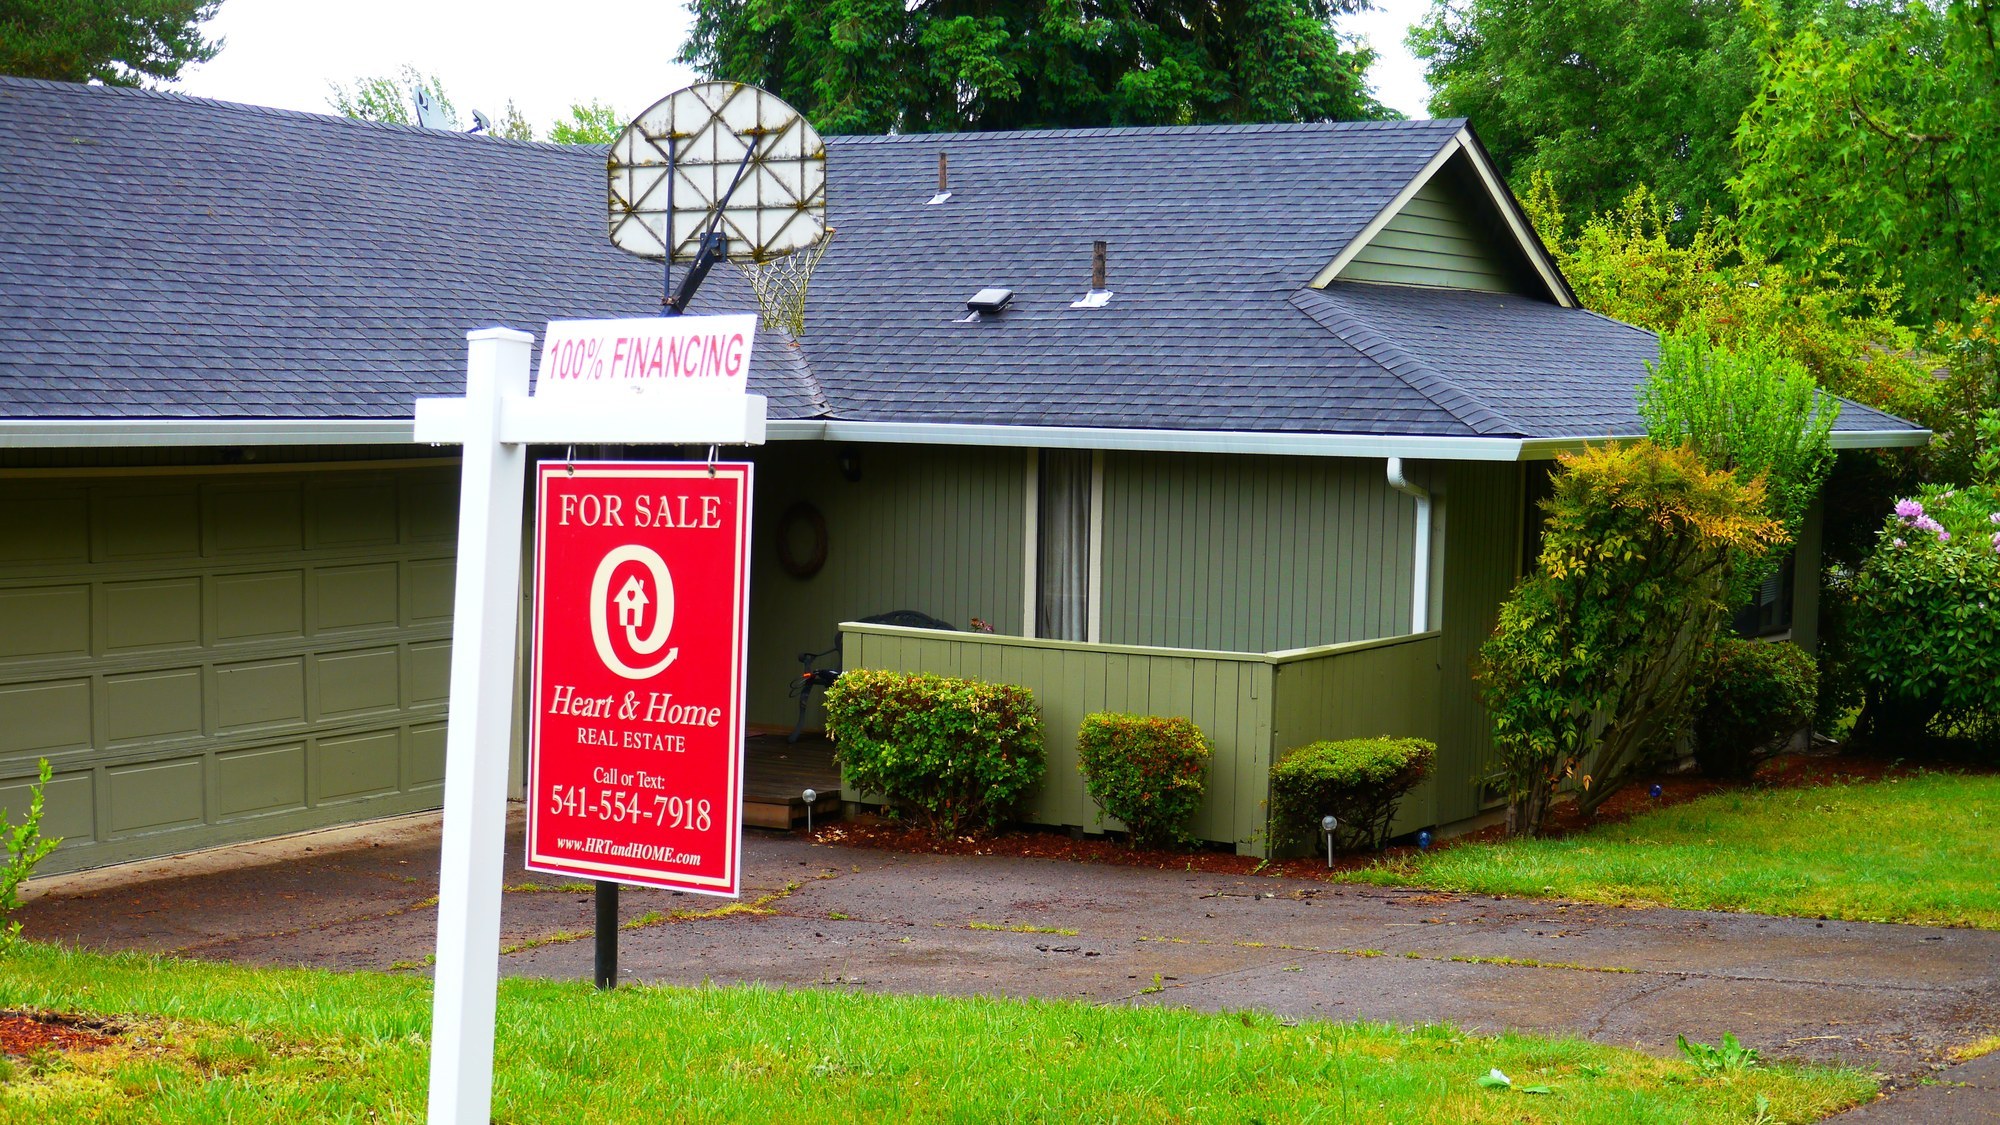
National foreclosure figures describe the country as a whole, but the risk of losing a home to foreclosure in August was not spread evenly across it. Three states, South Carolina, Nevada and Florida, posted the highest foreclosure rates in the nation, led by South Carolina at one filing for every 1,547 housing units, according to property-data firm ATTOM. That rate is a measure of concentration, not raw volume, and it puts South Carolina well ahead of most of the country on a per-household basis even though it is a mid-sized state. Nevada and Florida followed close behind on the same measure, meaning the three states leading the country in August were not simply the three largest by population, but the three where foreclosure filings were most concentrated relative to the number of homes each one has.
South Carolina Posts The Nation’s Highest Foreclosure Rate
South Carolina recorded one foreclosure filing for every 1,547 housing units in August, the highest rate of any state, according to ATTOM’s August 2026 Foreclosure Market Report. That works out to roughly six-tenths of a foreclosure filing per thousand homes statewide during the month, a concentration high enough to lead the country even though South Carolina’s total population and housing stock are far smaller than the states that typically produce the largest raw foreclosure counts.
A rate ATTOM tracks, a bill it doesn’t: South Carolina’s 1-in-1,547 foreclosure rate measures who is already behind, not the property-tax and utility relief that can keep the next homeowner from getting there. Check the renewal calendar in The Senior Property Tax & Home-Cost Relief Kit.
Nevada And Florida Round Out The Top Three
Nevada followed with one filing for every 1,920 housing units, and Florida was third at one for every 2,397, both trailing South Carolina’s rate but still well ahead of the national pattern, per the same ATTOM report. Florida’s rate coexists with the state also posting the highest raw count of foreclosure starts of any state in August, meaning Florida’s housing stock is large enough that a comparatively lower per-household rate still translates into the largest single-state total in the country.
All three states draw a meaningful share of older residents, whether relocating for retirement or aging in place in homes bought decades ago, which means a foreclosure rate running ahead of the national pattern in any of them carries a proportionally larger stake for retirees than the same rate would in a state with a younger population mix.
What A “1 In 1,547” Rate Actually Compares
ATTOM’s state rates divide each state’s foreclosure filings by its total housing units, which is why a state can rank first on the rate while another ranks first on the raw count. South Carolina’s smaller housing stock means fewer total filings can still produce the highest concentration in the country, while Florida’s much larger stock means a lower per-household rate still adds up to the most filings of any single state. Reading the two kinds of number together, rather than either alone, is what shows both how widespread a state’s foreclosure problem is and how large it is in absolute terms. A homeowner checking whether local conditions are worse than the national picture suggests needs the rate, not the raw count, since a state’s population size otherwise makes the comparison meaningless.
The Same National Caveat Applies At The State Level
Rob Barber, ATTOM’s CEO, has cautioned in the same report that overall foreclosure volumes remain well below historical norms, a national qualifier that still leaves room for individual states to run well above that average, as South Carolina, Nevada and Florida did in August. A homeowner in one of those three states is facing a materially higher local risk than the national figures alone would suggest, even in a year ATTOM describes as historically moderate overall. That same report, not a state agency or a local news account, is the source for all three states’ rankings and rates cited here.
A State-Level Rate, And The Same Ongoing Housing Costs
South Carolina’s 1-in-1,547 rate, and the Nevada and Florida figures behind it, describe how concentrated foreclosure activity is in each state, but none of the three numbers accounts for the property taxes, insurance premiums or utility bills a homeowner in any of those states keeps paying whether or not a foreclosure notice ever arrives. Staying ahead of those recurring costs is a separate, ongoing task from responding to a filing once one starts.
The Senior Property Tax & Home-Cost Relief Kit sets the circuit-breaker credit that includes renters next to property-tax freezes, tracking both on a renewal calendar for keeping each one current.
Walk through the five kinds of relief in The Senior Property Tax & Home-Cost Relief Kit.
This article was produced with AI assistance and checked against the primary sources linked above.