On May 19, 2026, the 30-year U.S. Treasury bond closed at a yield of 5.19%, according to the Treasury Department’s daily par yield curve. That is the highest closing level since 2007, before the financial crisis rewired the global economy and ushered in more than a decade of historically low interest rates. And a majority of the world’s largest institutional investors think yields are heading higher: 62% of respondents in Bank of America’s May 2026 Global Fund Manager Survey said they expect the 30-year yield to reach 6%, a level not seen since 2000.
If they are right, the fallout will reach far beyond bond trading desks. Federal interest costs, already approaching $1 trillion a year, would keep climbing. Corporations that borrowed cheaply during the pandemic would refinance at punishing rates. And prospective homebuyers who spent years waiting for relief would face a market moving decisively against them.
What the official data shows
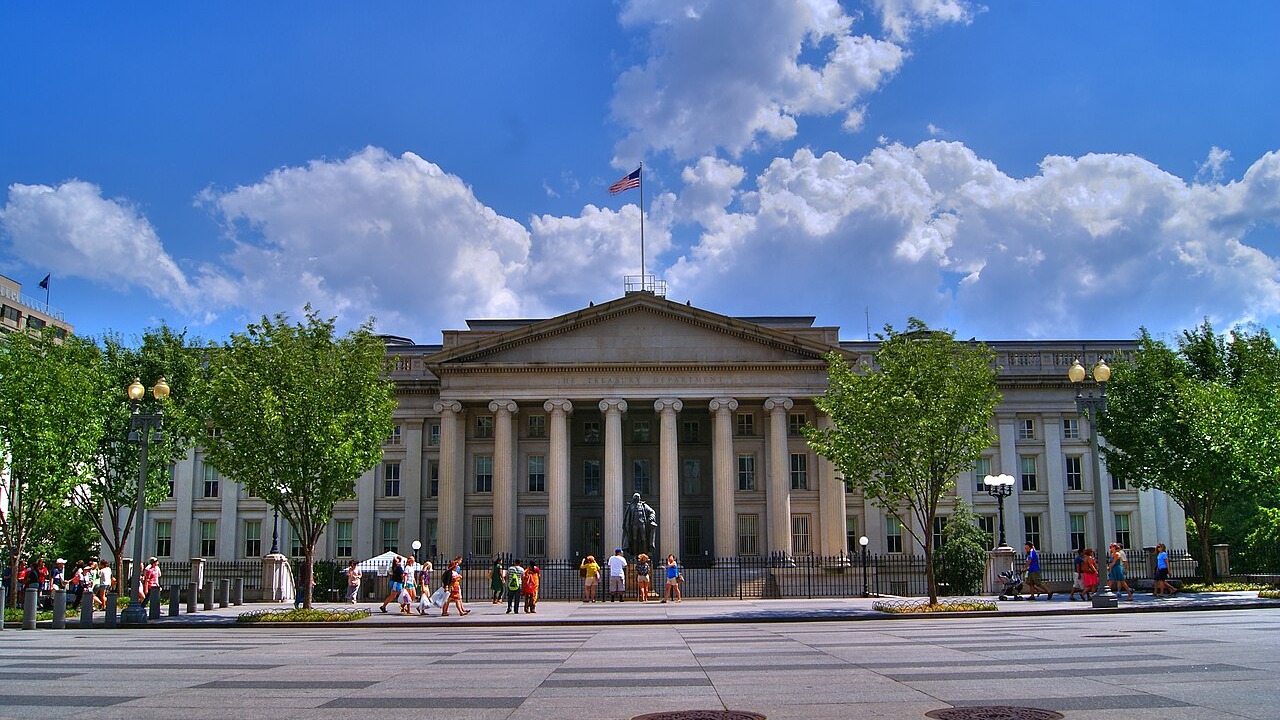
The 5.19% figure is not a market estimate or a dealer’s quote. It comes from the Treasury’s constant maturity series, the benchmark dataset that feeds the Federal Reserve’s H.15 statistical release and the widely used FRED GS30 time series maintained by the Federal Reserve Bank of St. Louis. All three sources align: the May 19 close was the highest print in nearly two decades.
Bloomberg reporting from the same session described the move as part of a broader global bond selloff, with the 30-year yield touching roughly 5.20% intraday before settling at the official close. Intraday prints fluctuate, but the closing data from Treasury and the Fed anchor the milestone in numbers anyone can verify independently.
Why yields are surging
No single catalyst explains the move. Several forces are converging on the long end of the curve at once:
- Persistent inflation. Core inflation has remained above the Federal Reserve’s 2% target for longer than most forecasters anticipated. For investors weighing whether to lock in a fixed rate for three decades, that persistence demands a higher yield as compensation.
- A flood of new supply. The federal deficit continues to widen, forcing the Treasury to auction large volumes of long-dated debt. More supply, all else equal, pushes bond prices down and yields up. Quarterly refunding announcements in 2026 have consistently featured larger-than-expected issuance of 20- and 30-year bonds.
- Retreating foreign buyers. Japan and China, the two largest overseas holders of U.S. Treasuries, have been gradually trimming their portfolios or slowing purchases for several years. That has removed a source of demand that helped suppress yields for much of the post-crisis era.
- A fatter term premium. Investors are demanding more compensation for the sheer uncertainty of holding a 30-year bond. The repricing reflects not just inflation risk but growing doubts about long-run fiscal sustainability and the path of central-bank policy. The Federal Reserve Bank of New York’s ACM term premium model has shown the 30-year term premium rising steadily since late 2025.
Neither the Treasury Department nor the Federal Reserve has isolated a single driver behind the May move. The selloff is better understood as the market repricing several risks simultaneously.
Where the Fed stands
The Federal Reserve held the federal funds rate at its current level at its May 2026 meeting, continuing a pause that has lasted several months. Chair Jerome Powell has repeatedly said the central bank needs “greater confidence” that inflation is sustainably returning to 2% before cutting rates. That stance has left short-term rates elevated while long-term yields have surged independently, steepening the yield curve in a way that signals the bond market is pricing in persistent inflation and fiscal risk rather than an imminent recession.
The Fed does not directly control the 30-year yield, but its policy posture shapes the environment. By holding rates steady and allowing its balance sheet to shrink through quantitative tightening, the central bank has effectively stepped back as a buyer of long-duration Treasuries, adding to the supply pressure the market must absorb.
The 6% question
Bank of America’s Global Fund Manager Survey polls hundreds of portfolio managers who collectively oversee trillions of dollars, making it one of the most closely watched sentiment gauges in institutional finance. The May 2026 edition found that 62% of respondents expect the 30-year yield to reach 6%.
That number deserves context. The survey captures positioning and expectations, not a consensus forecast with a disclosed confidence interval. BofA does not publish the full methodology or raw responses publicly, so the 62% figure is best treated as an attributed sentiment reading rather than a modeled prediction. Still, the direction is striking: a clear majority of large-money managers are bracing for yields to move meaningfully higher, not lower.
Historical parallels offer limited guidance. The last sustained stretch above 5% came during 2006 and 2007, an era defined by aggressive credit expansion, a housing bubble, and a Federal Reserve tightening into what turned out to be a systemic crisis. The economic backdrop in mid-2026, with its own combination of fiscal strain, post-pandemic labor market shifts, and geopolitical friction, is different enough to make simple analogies unreliable.
How equity markets and other asset classes are responding
Rising long-term yields have created a gravitational pull across asset classes. Equity markets have felt the pressure most visibly: higher discount rates reduce the present value of future corporate earnings, and rate-sensitive sectors such as real estate investment trusts, utilities, and high-growth technology stocks have underperformed the broader market since the bond selloff accelerated in the spring of 2026. The S&P 500 has traded in a choppy range as investors weigh still-solid corporate earnings against the rising cost of capital.
In credit markets, investment-grade corporate bond spreads have remained relatively tight, but the all-in yield on new issuance has climbed to levels not seen since before the financial crisis, raising refinancing risk for leveraged borrowers. High-yield spreads have widened modestly, reflecting caution rather than panic so far.
Gold and other traditional inflation hedges have attracted renewed interest, while the U.S. dollar has strengthened against most major currencies as higher Treasury yields draw global capital. For diversified investors, the message from cross-asset moves is consistent: the repricing of long-term rates is not confined to the bond market but is rippling through portfolios of every kind.
What it means for borrowers and investors
Long-term Treasury yields set the floor for borrowing costs across the economy. The 30-year fixed mortgage rate, while more directly tied to the 10-year Treasury and mortgage-backed securities spreads, moves in sympathy with the entire long end of the curve. As of the week ending May 22, 2026, the average 30-year fixed mortgage rate was near 7.2%, according to Freddie Mac’s Primary Mortgage Market Survey. That is roughly double the sub-3% rates available in early 2021.
In household terms: the monthly principal and interest payment on a $400,000, 30-year fixed-rate mortgage at 3% is about $1,686. At 7.2%, it is roughly $2,714, an increase of more than $1,000 a month for the same loan amount. If the long bond were to reach 6% and mortgage rates climbed in tandem, that gap would widen further, pricing additional buyers out of the market or pushing them toward smaller homes and longer commutes.
Corporate borrowers face a parallel squeeze. Companies that locked in cheap debt during 2020 and 2021 are beginning to refinance at substantially higher yields. Investment-grade corporate bond spreads have remained relatively contained, but the absolute level of yields means even high-quality issuers are paying more in interest than at any point since before the financial crisis.
For the federal government, the math is blunt. The Treasury is financing a national debt that surpassed $36 trillion in early 2026, and every basis point of higher yield on new issuance adds to the annual interest bill. The Congressional Budget Office’s February 2026 budget outlook projected that net interest costs would consume a growing share of federal revenue over the next decade, eventually rivaling defense spending. A sustained move toward 6% on the long bond would accelerate that timeline.
What could reverse or accelerate the bond selloff
The evidence as of June 2026 is clear on one point: the 30-year Treasury yield is at its highest level since before the financial crisis, confirmed by the government’s own data. The BofA survey adds a credible but inherently uncertain layer of market sentiment suggesting further upside in yields.
What remains genuinely unknown is whether the 6% threshold will be reached, how long yields will stay elevated, and whether the Federal Reserve will intervene more aggressively if financial conditions tighten enough to threaten growth. Fund-manager surveys have been wrong before, sometimes spectacularly. Bond markets have a long history of reversing sharply when a consensus trade becomes too crowded. And any meaningful progress on inflation or deficit reduction could pull yields back down.
For now, the numbers speak plainly. Borrowing costs are at levels that most Americans under 40 have never experienced as adults, and the investors who manage the world’s largest pools of capital are betting those costs will go higher. Whether that bet pays off depends on inflation, fiscal policy, and central-bank decisions that have not yet been made. The only thing that is settled is this: the era of historically cheap long-term money is over, and the economy is still adjusting to what comes next.