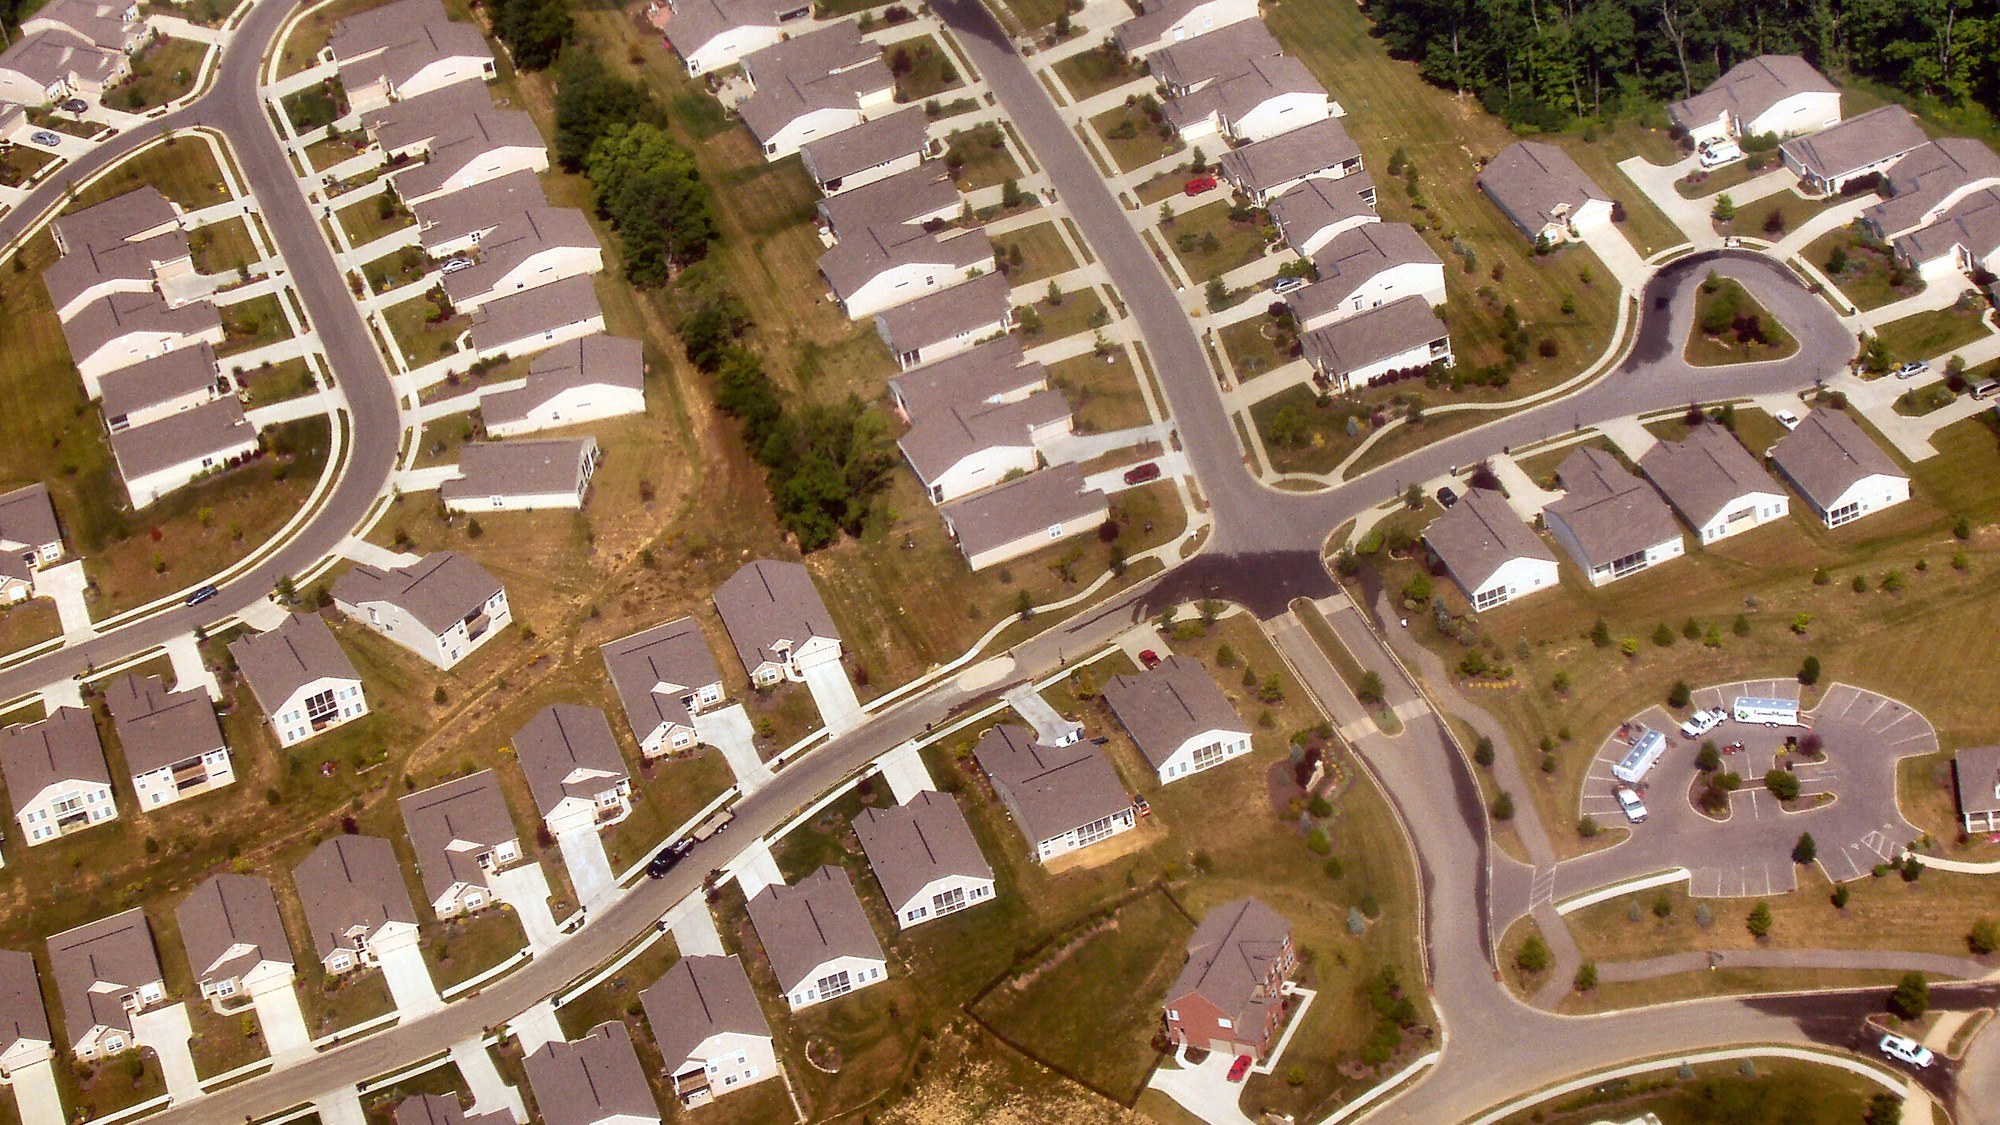
New single-family homes for sale at the end of August represented 8.5 months of supply at the pace homes were selling, down from 9.0 months in July. The reading comes from the August edition of the federal New Residential Sales report, which counts houses that builders have finished or are still building but have not sold. A drop of half a month sounds like a clear easing, yet the release itself attaches a wide margin of error to the change.
Months’ supply in the Census and HUD release
The U.S. Census Bureau and the Department of Housing and Urban Development published the figures on September 24. According to the New Residential Sales release, “this represents a supply of 8.5 months at the current sales rate.” The Bureau describes that as 5.6 percent below the July estimate of 9.0 months, and virtually unchanged from the 8.5 months recorded in August 2025.
The measure is a ratio, not a count. It divides the seasonally adjusted number of new houses for sale by the seasonally adjusted annual sales rate, so it answers one question: how long would the current stock last if sales continued at the latest pace and builders added nothing. A lower figure means the stock is shrinking relative to demand, a higher one means it is piling up.
What the margin of error says about the 5.6 percent drop
Every monthly change in the release is printed with a range. The months’ supply decline carries a range of plus or minus 17.2 percent, far wider than the 5.6 percent move itself. The Census Bureau’s explanatory note sets the rule: “If a range does not contain zero, the change is statistically significant. If it does contain zero, the change is not statistically significant.”
Applying that rule, the fall from 9.0 to 8.5 months cannot be separated from sampling noise. The same caution holds for the year-over-year comparison, which shows no change at all, 8.5 months in August 2025 and 8.5 months now. The accurate reading of the headline number is a small decline that the survey cannot distinguish from zero, in a month when supply sits at the same level as a year earlier.
483,000 houses for sale and a 684,000 sales pace
Both halves of the ratio were close to flat. The seasonally adjusted estimate of new houses for sale at the end of August was 483,000, the same level as July and 2.0 percent (plus or minus 4.0 percent) below the 493,000 of August 2025.
Sales of new single-family houses ran at a seasonally adjusted annual rate of 684,000, against 643,000 in July. The Bureau puts that at 6.4 percent above July with a range of plus or minus 19.5 percent, which includes zero, so the release does not treat it as a significant rise. It was 2.0 percent (plus or minus 15.7 percent) below the August 2025 rate of 698,000. With inventory unchanged, the half-month improvement in supply came from the sales estimate moving up, and that estimate is the least certain number on the page.
New-home prices: the one move the release treats as significant
The median sales price of new houses sold in August was $393,700, up 0.4 percent from July and down 5.8 percent from a year earlier. The release flags the year-over-year median price decline as statistically significant, the one price or volume change among those reported here that clears the Bureau’s bar. The average price was $478,700, down 9.1 percent from July and 8.8 percent from August 2025.
Median and average prices of new homes swing with the mix of what sells, including size, region and price tier, so a falling median does not by itself show that comparable houses cost less. The release reports what was sold, not what any single house would fetch.
The gap between the two price series matters for how the supply number is read. A builder carrying more than eight months of unsold stock has a reason to cut prices or add incentives, and a significant fall in the median is consistent with that, though the release does not state a cause.
New homes against the existing-home market
The existing-home market looks very different. The National Association of Realtors, a trade group, reported in its August existing-home sales report a median price of $429,100, up 1.6 percent from a year earlier, with 4.9 months of supply at a 3.98 million annual sales rate. Existing homes therefore carried roughly half the months of supply of new construction, and their median price rose while the new-home median fell. The two reports are built differently and are not interchangeable, but together they show resale inventory far tighter than builder inventory.
The next New Residential Sales report, covering September, is scheduled for October 27, and it will show whether the supply figure holds near 8.5 or drifts back toward 9.0.
Property-tax and home-cost help for homeowners and renters
Homeowners and renters on fixed incomes often miss relief programs because each program has its own application, and renewal dates are easy to lose track of.
The Senior Property Tax & Home-Cost Relief Kit is an 11-page kit that lays out the 5 kinds of property-tax relief and the circuit-breaker credit that includes renters, so a reader can see which programs to look up for their own home.
This article was drafted with AI assistance from the cited official sources and checked against them before publication.