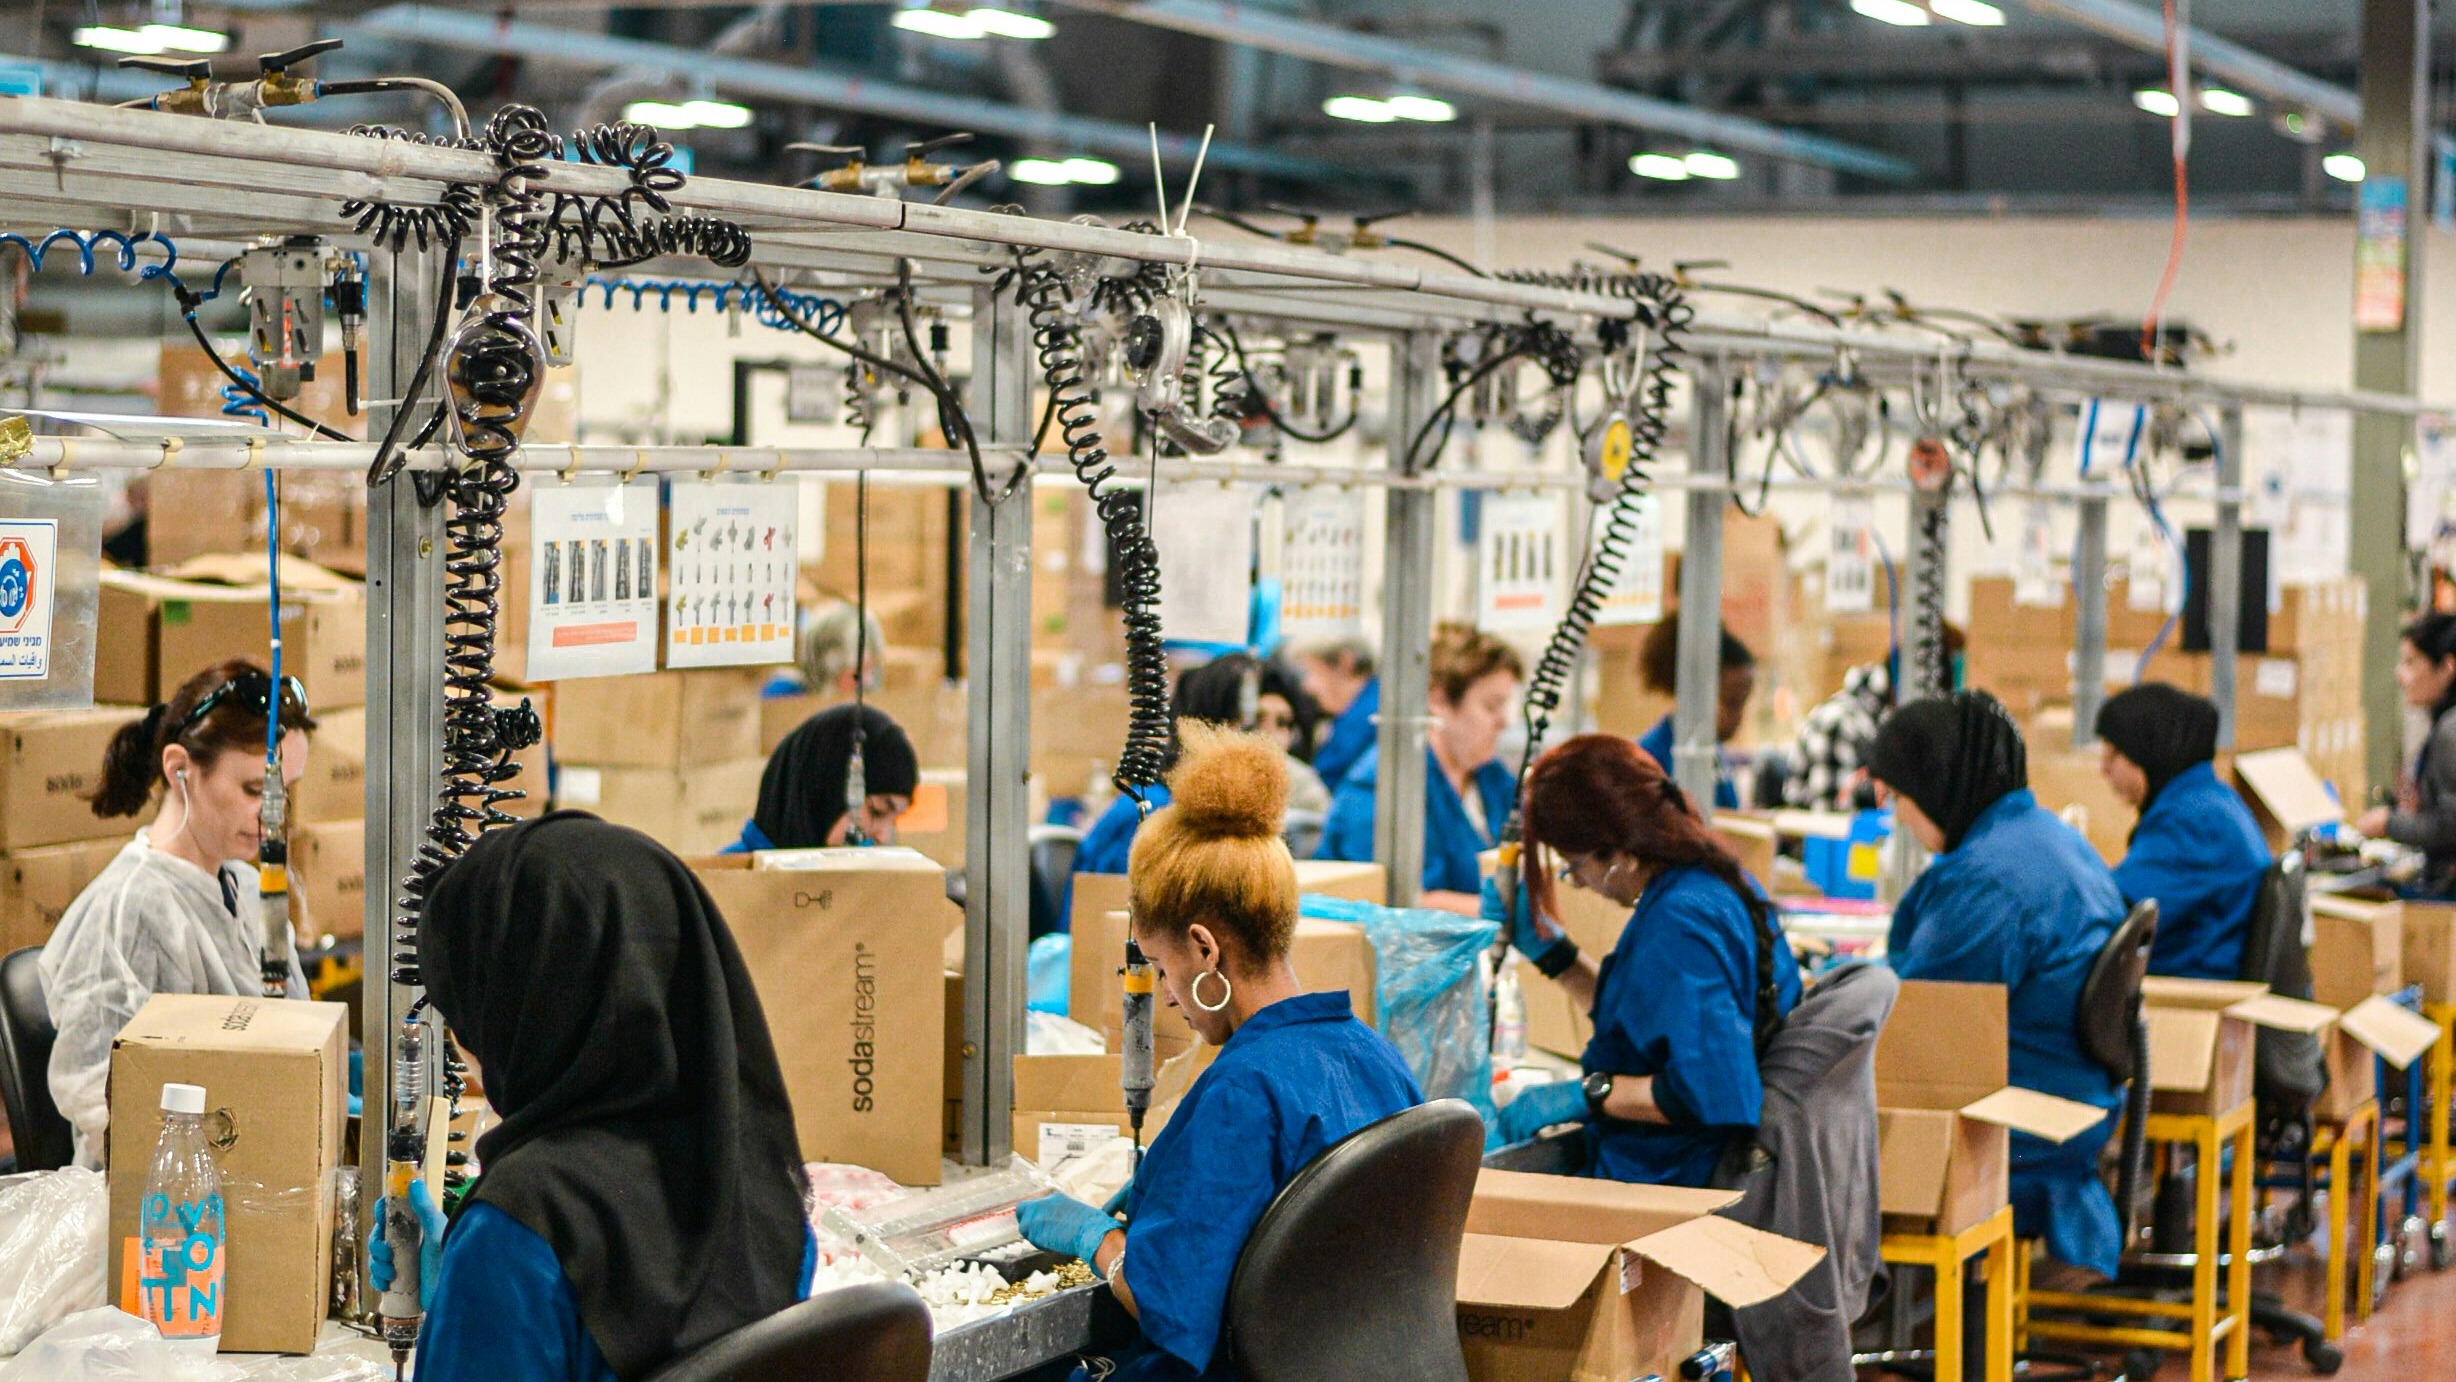
American manufacturers entered the second half of 2026 facing weaker demand and softer hiring, according to federal data released on July 2. The Bureau of Labor Statistics published its Employment Situation report for June, confirming that factory payrolls cooled alongside new orders. Separately, the Federal Reserve’s most recent industrial production figures showed manufacturing output was flat in May, raising the question of whether the sector’s spring momentum has stalled out entirely.
Flat output and cooling orders signal a factory sector losing speed
The convergence of three federal data releases tells a consistent story: U.S. factories are producing less new activity than they were earlier in the year. The Federal Reserve’s broad industrial production data recorded manufacturing output unchanged in May, the latest month available before the June jobs figures landed. That flat reading separated hard production numbers from the softer sentiment captured in private purchasing managers’ surveys, which had already flagged declining new orders.
The Census Bureau’s advance report on durable goods manufacturers’ shipments, inventories, and orders provides another official benchmark. Its monthly durable goods release tracks orders placed with factories for goods meant to last three years or more, covering everything from aircraft to appliances. When those orders weaken, production lines typically slow within one to two quarters, and the hiring tied to those lines follows.
One hypothesis worth tracking is that the June slowdown could appear first in temporary-help services employment before broader manufacturing payrolls decline further. Factories often cut contract and temp workers before reducing permanent headcount, making the temporary-help line in the BLS data an early signal. The next two monthly employment reports will test whether that pattern holds and whether manufacturers are preparing for a more prolonged downshift in demand.
What BLS payrolls, Fed output, and Census orders show together
The June employment report from BLS, dated July 2, 2026, draws on both a survey of employers and a separate household survey. Its manufacturing employment tables offer the clearest official count of factory jobs gained or lost in a given month, distinct from sentiment-based diffusion indexes produced by private groups. When those payroll figures confirm a hiring pullback that private surveys have flagged, the signal carries more weight because BLS data cover the full economy rather than a sample of purchasing managers.
The Fed’s May 15 G.17 update established the output baseline heading into June. With manufacturing output unchanged that month, any further softness in June would mark a stretch of stagnation not seen since the sector’s immediate post-pandemic adjustment period. Capacity utilization rates published alongside the G.17 also matter for pricing: when factories run well below capacity, they lose leverage to raise prices, which feeds back into revenue and hiring decisions.
Taken together, these three primary government datasets, from BLS, the Fed, and the Census Bureau, separate verified production and employment trends from the noisier signals of business-confidence surveys. For workers on factory floors and suppliers feeding those plants, the distinction is practical. A purchasing managers’ index can swing on expectations alone, but a flat output reading backed by weaker orders and softer payrolls points to a real slowdown that shows up in shifts, overtime, and investment plans.
Implications for workers, wages, and investment
For manufacturing workers, the immediate risk is fewer hours rather than widespread layoffs. Employers that struggled to recruit and train during the post-pandemic rebound have an incentive to hold on to experienced staff, even if that means trimming overtime or slowing new hiring. The BLS data will be watched closely for changes in average weekly hours in factory industries, which often turn before headline job counts.
Wage growth in manufacturing could also moderate if demand remains soft. When order books are thin and capacity is underused, managers have less room to grant aggressive pay increases or bonuses tied to production targets. That, in turn, can weigh on local economies in manufacturing-heavy regions, where factory paychecks support a wide range of service jobs.
On the investment side, flat output and weaker orders typically prompt companies to delay capital spending on new equipment or plant expansions. The Census Bureau’s durable goods figures, which include nondefense capital goods excluding aircraft, serve as a proxy for business investment plans. A sustained pullback there would suggest that manufacturers are bracing for slower sales well into 2027, not just navigating a temporary pause.
Policymakers will be parsing these indicators for clues about broader economic momentum. If manufacturing weakness remains contained while consumer spending and services hiring stay firm, the overall expansion could continue, albeit with a smaller contribution from factories. But if the drag from industry spreads to transportation, warehousing, and business services, the combined effect could meaningfully slow national job and income growth.
For now, the message from the official data is clear: the manufacturing surge that helped power the early phase of the recovery has cooled. Whether this becomes a brief plateau or the start of a more persistent downshift will depend on how quickly new orders revive – and how long factory owners are willing to wait before making deeper cuts to payrolls and production plans.