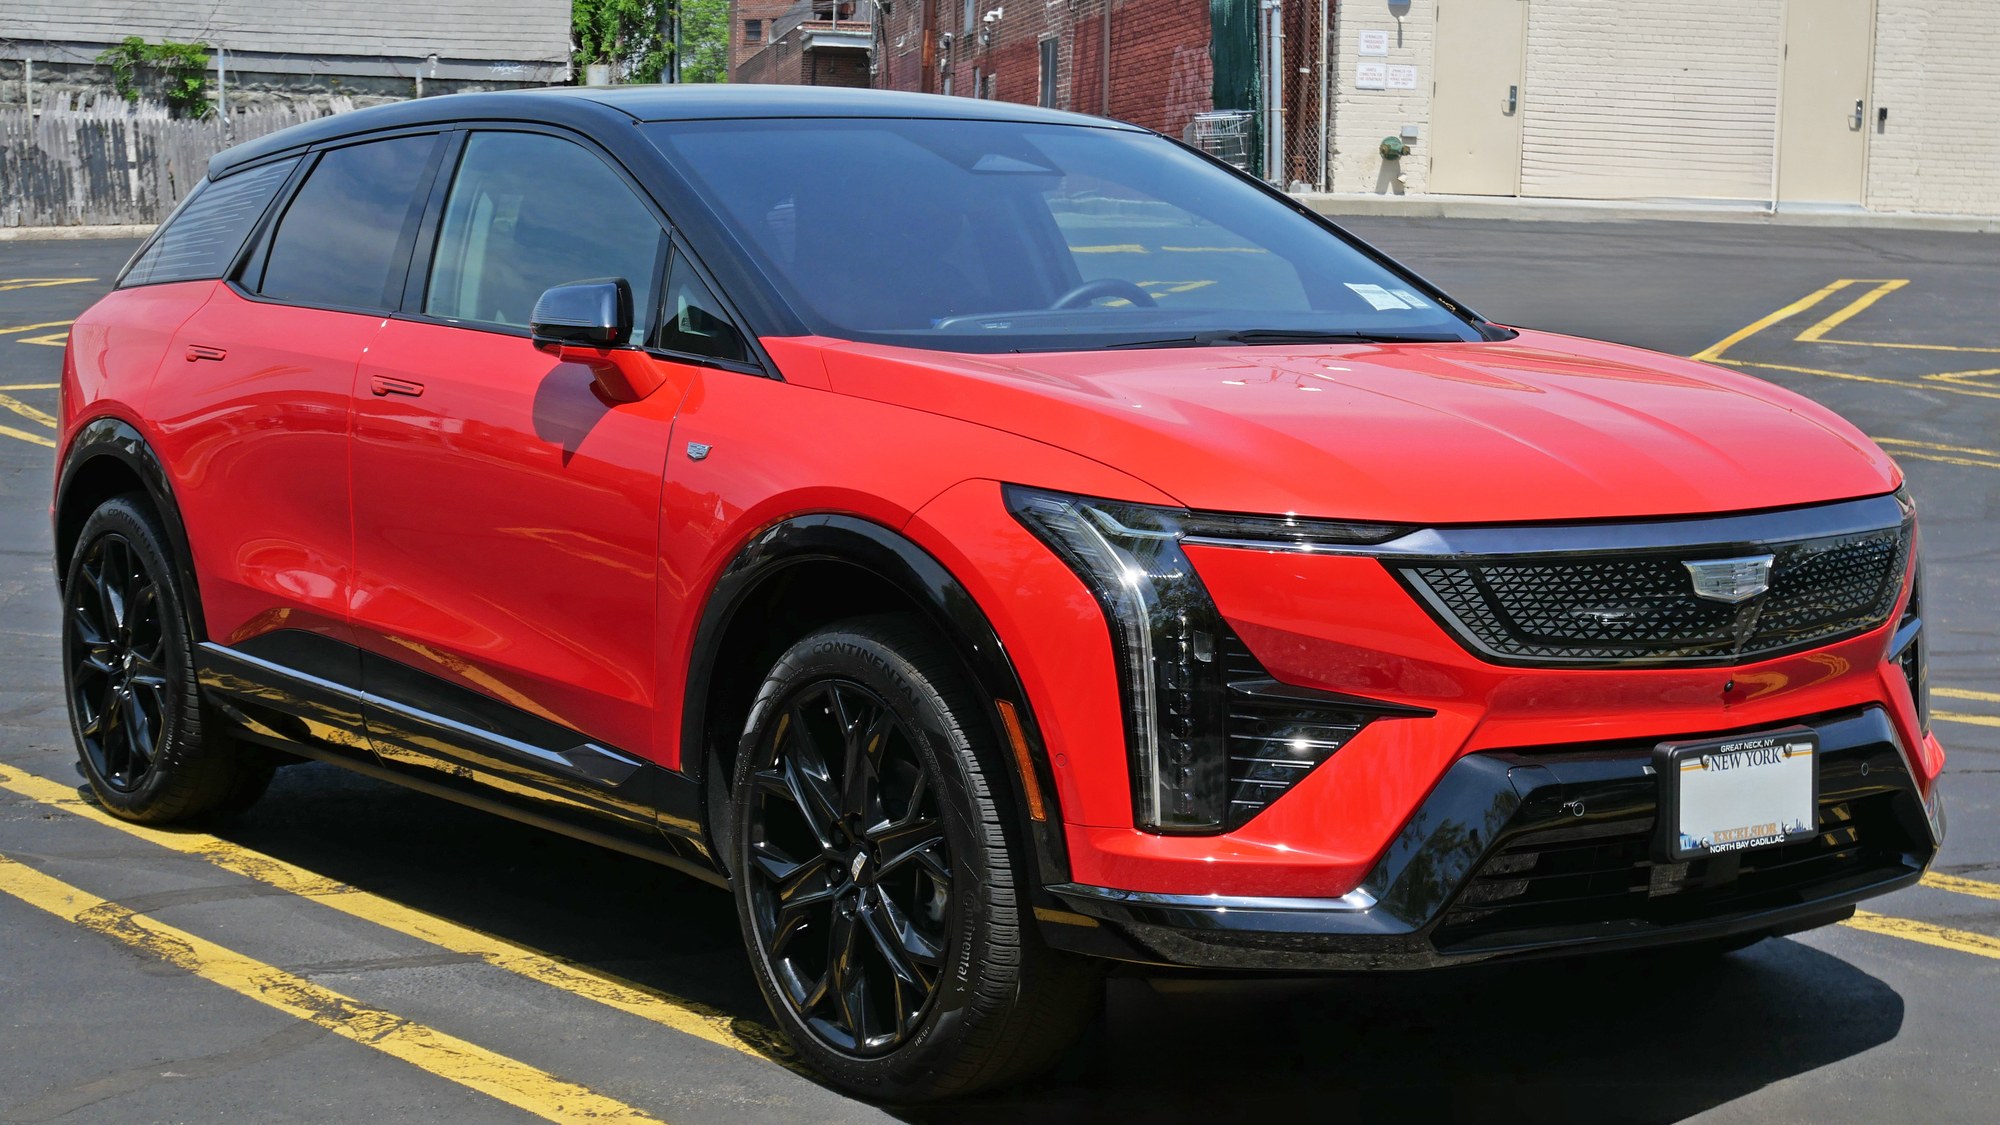
American car buyers face a punishing sticker price. The average transaction price for a new vehicle sits near $49,000, hovering close to its all-time peak. That figure has climbed sharply since 2020, driven by pandemic-era supply shortages, a shift toward larger trucks and SUVs, and persistent cost pressures across the auto supply chain. For households that need to replace an aging car, the math is blunt: bigger loans, longer repayment terms, and monthly payments that eat deeper into take-home pay.
Why a $49,000 average price changes buyer behavior
The strain is not just psychological. When new-vehicle prices stay elevated well above their pre-2020 trend, buyers respond by holding onto their current cars longer. Government price measures confirm the sustained climb. The Bureau of Economic Analysis publishes a chain-type auto index through the Federal Reserve Bank of St. Louis, and that series shows a steep upward trajectory since the pandemic low, with no meaningful retreat toward earlier levels. The index is inflation-adjusted, which means the increase reflects real purchasing-power loss for consumers, not just nominal inflation.
A reasonable expectation follows from this data: if the BEA new-auto price index remains above its pre-2020 trend line, average vehicle holding periods should lengthen in subsequent household expenditure surveys. Buyers who cannot absorb a near-$49,000 outlay simply keep driving what they already own. That dynamic feeds back into the used-car market, tightening supply of late-model trade-ins and keeping secondhand prices elevated as well.
Higher prices also change what people buy. Some shoppers who once aimed for a new midsize SUV may downshift to a compact model, a lower trim level, or a remaining sedan. Others cross-shop certified pre-owned vehicles, hoping to capture some of the warranty protection of a new car without paying full freight. Even within the new-vehicle market, buyers may accept fewer options, forgo premium sound systems or driver-assistance bundles, and focus on the lowest monthly payment the dealer will quote.
How BLS and BEA track the price surge
Two federal agencies provide the clearest evidence of the price run-up, though neither publishes the dollar-denominated average transaction price that industry trackers report. The Bureau of Labor Statistics measures new-vehicle prices through its Consumer Price Index, drawing on actual transaction records rather than sticker prices. According to the BLS methodology, the agency uses geometric averaging of transaction prices and applies quality adjustments so that feature upgrades do not artificially inflate the index. That distinction matters: the CPI new-vehicles component aims to isolate pure price change from content change, giving a conservative read on how much more buyers pay for comparable vehicles.
The BEA’s personal consumption expenditures price index for new autos, a separate chain-type measure, tells a consistent story. Both indexes have moved sharply higher since 2020 and have not returned to their earlier trajectory. The underlying statistical work is part of the broader infrastructure maintained through the U.S. labor department, which supports the CPI calculations that influence wage bargaining, benefit formulas, and inflation expectations throughout the economy.
While headline CPI releases summarize the trend, more detailed tables are available through the BLS’s online data tools. Using the agency’s interactive database, analysts can pull historical readings for the new-vehicles category, compare it with used-car prices, and examine how quickly each component has risen relative to overall inflation. That level of granularity helps separate temporary spikes from more structural shifts in the cost of owning a car.
Neither agency, however, produces the specific dollar figure that industry sources cite as the average transaction price. That number typically comes from proprietary datasets compiled by firms that track what dealers actually collect at the point of sale, including incentives, fees, and option packages. The government indexes confirm the direction and magnitude of the trend but express it as index values rather than a sticker price.
Gaps in the data and what buyers should watch next
Several questions remain open. No primary government source documents the current spread between manufacturer suggested retail price and the final transaction amount, or how aggressively dealers are discounting certain models as inventories recover. Public data also say little about how much of the price increase reflects higher financing costs versus the underlying vehicle itself, even though interest rates can significantly change the total cost of ownership.
For consumers trying to navigate this environment, a few signals are worth watching. First, movements in the CPI and BEA auto indexes can indicate whether price pressures are easing or simply plateauing at a higher level. A flattening index suggests that while cars remain expensive, the worst of the acceleration may be over. Second, changes in used-vehicle prices often foreshadow shifts in the new-car market: if used prices begin to soften, dealers may face more resistance to premium new-car pricing.
Finally, buyers should pay close attention to the structure of loan offers. Longer terms can mask the impact of high prices by keeping monthly payments manageable, but they extend the period during which a borrower may owe more than the car is worth. In a world where the average new vehicle costs nearly $49,000, the combination of elevated prices and stretched financing can lock households into years of tight budgets. Until the official price indexes show a clearer downtrend, the pressure on car buyers is likely to remain a defining feature of the U.S. auto market.