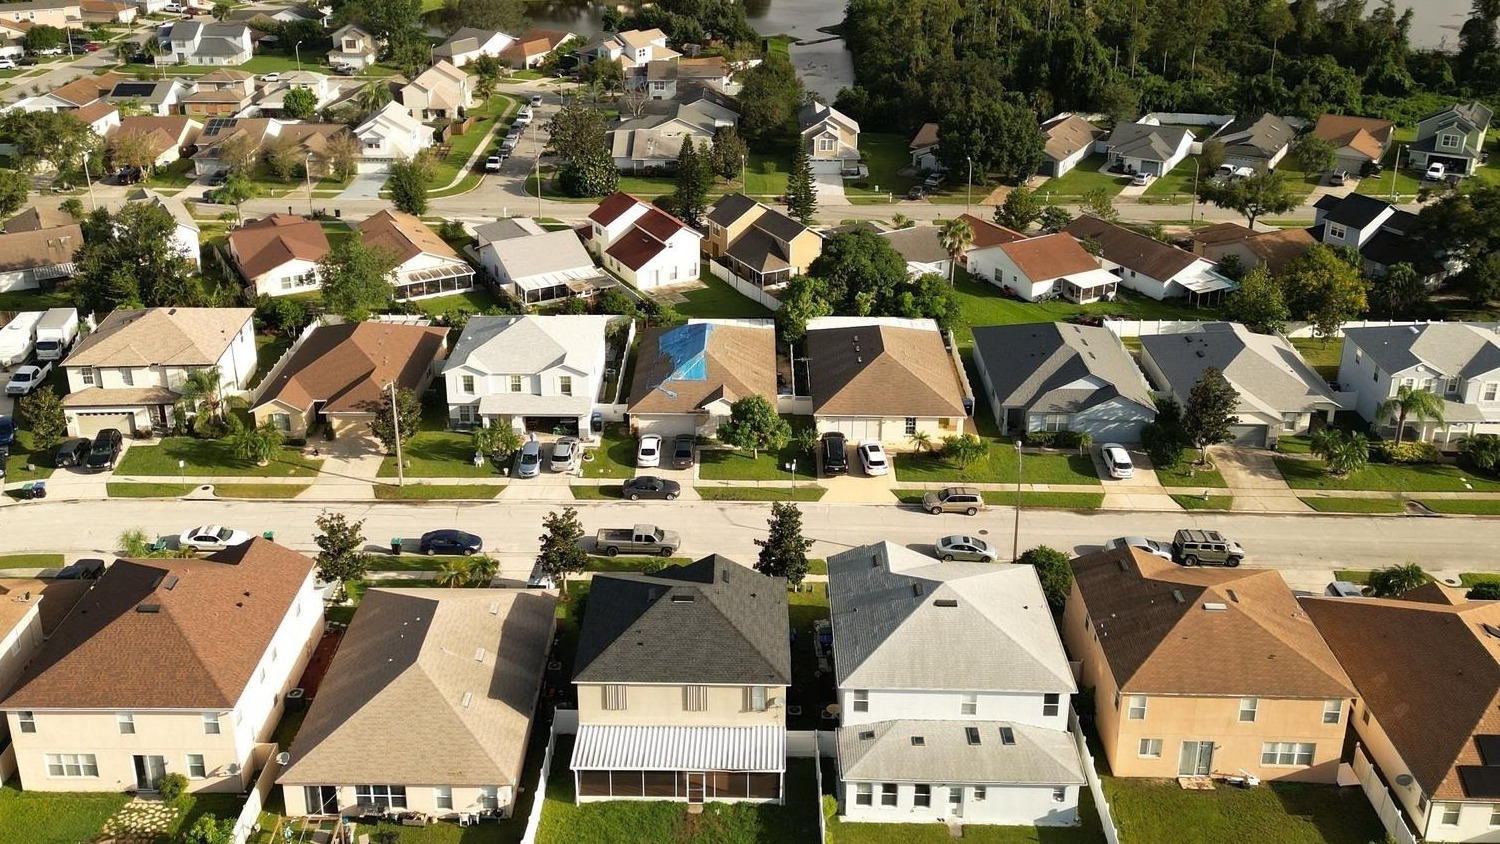
Private residential construction ran at a seasonally adjusted annual rate of $882.3 billion in August, Census Bureau data released on October 1 show, up from a revised $872.7 billion in July. The monthly gain is 1.1 percent, but the bureau’s margin of error on it is plus or minus 1.3 percent, so the increase cannot be told apart from no change at all. Housing work makes up roughly 40 percent of everything built in the country, by the same release’s own totals.
The figure is a pace, not a tally. A seasonally adjusted annual rate takes one month’s activity, strips out the normal seasonal pattern, and expresses what the year would add up to if that month’s speed held for twelve months.
Housing’s share of the $2,203.1 billion total
Census put total construction in August at a seasonally adjusted annual rate of $2,203.1 billion. Private residential, at $882.3 billion, is about 40 percent of that, a share worked out here by dividing the two published figures. Private nonresidential construction, at $773.0 billion, is about 35 percent, and public construction, at $547.8 billion, is about 25 percent, on the same arithmetic.
The residential line sits under private construction in the Census release, which is why the figure here is labeled private residential. The bureau’s definitions page classes projects as private or public by ownership during the construction period, so a government-owned housing project would fall on the public side of the ledger, not in the $882.3 billion.
A 1.1 percent monthly gain that sits inside its margin of error
The step from $872.7 billion in July to $882.3 billion in August is $9.6 billion at an annual rate. Census states the percentage as 1.1 percent with a margin of plus or minus 1.3 percent. Because that interval runs from below zero to above it, the release does not establish that residential construction actually rose in August.
The sector next door behaves differently. Private nonresidential construction rose 1.0 percent with a margin of plus or minus 0.5 percent, a change that does clear its margin, and private construction as a whole rose 1.1 percent, also plus or minus 0.5 percent. Housing is the wide-margin part of the private total, so the level is the reliable number and the month-to-month change is not.
That is the pattern the margin of error exists to flag. A reader scanning the headline level of $882.3 billion would see a large number in a large sector, but with that margin only the level, and not the monthly direction, can be treated as firm. The $9.6 billion step is about 1.1 percent of the July base, and the interval around it is wider than the step itself.
What the pace implies month by month
Dividing $882.3 billion by twelve gives about $73.5 billion of private residential work per month at the August pace. That conversion is simple arithmetic, not a Census statistic, and it is useful mainly as a guard against a common misreading: $882.3 billion is not what was spent on housing construction in August itself, and it is not a year-to-date total either.
The cumulative figures live elsewhere in the release. Census reports total construction of $1,450.4 billion for the first eight months of 2026, 3.1 percent below the same period of 2025, and that comparison is stated for total construction, not for housing alone. Residential is part of the total in each case, but the two kinds of number are not interchangeable.
What the residential line covers, and what the release leaves out
In the bureau’s definitions, residential construction includes new houses and town houses built to be sold or rented and units built by the owner or for the owner on contract. The definitions page also separates single-family work, multifamily work covering new apartments and condominiums, and improvements, which include remodeling, additions and major replacements to owner-occupied properties but exclude maintenance and repair.
The summary figures examined here give private residential as a single line. They do not report how the $882.3 billion divides among single-family building, multifamily building and improvements, so no such split is asserted. The category-level tables are offered on Census’s at-a-glance page as downloadable files, in seasonally adjusted and unadjusted versions.
The revision that moved the comparison base
July’s private residential figure of $872.7 billion is a revised one, which matters for reading the change. The bureau treats recent monthly estimates as open to later revision, and the next release, covering September, is scheduled for November 2, 2026. If August is later revised, both the level and the 1.1 percent comparison can shift, and the wide margin of error suggests the direction of that shift is hard to predict.
The sourced statement stands on the October 1 release: private residential construction was at a seasonally adjusted annual rate of $882.3 billion in August 2026, 1.1 percent, plus or minus 1.3 percent, above July’s revised $872.7 billion, according to the Census Bureau’s August 2026 summary.
Circuit-breaker credits and home-cost help
The kit is written for homeowners and renters weighing a property-tax freeze, an exemption or a circuit-breaker credit, and for households looking for heating, cooling or home-repair help. Those programmes run on application windows set separately from one another.
The Senior Property Tax & Home-Cost Relief Kit explains the circuit-breaker credit that includes renters and the heating, cooling and home-repair help that sits alongside the property-tax programmes.
See how the circuit-breaker credit reaches renters, not only owners →
AI tools helped draft this piece, and each figure was compared with the Census Bureau’s October 1 release before it went live.