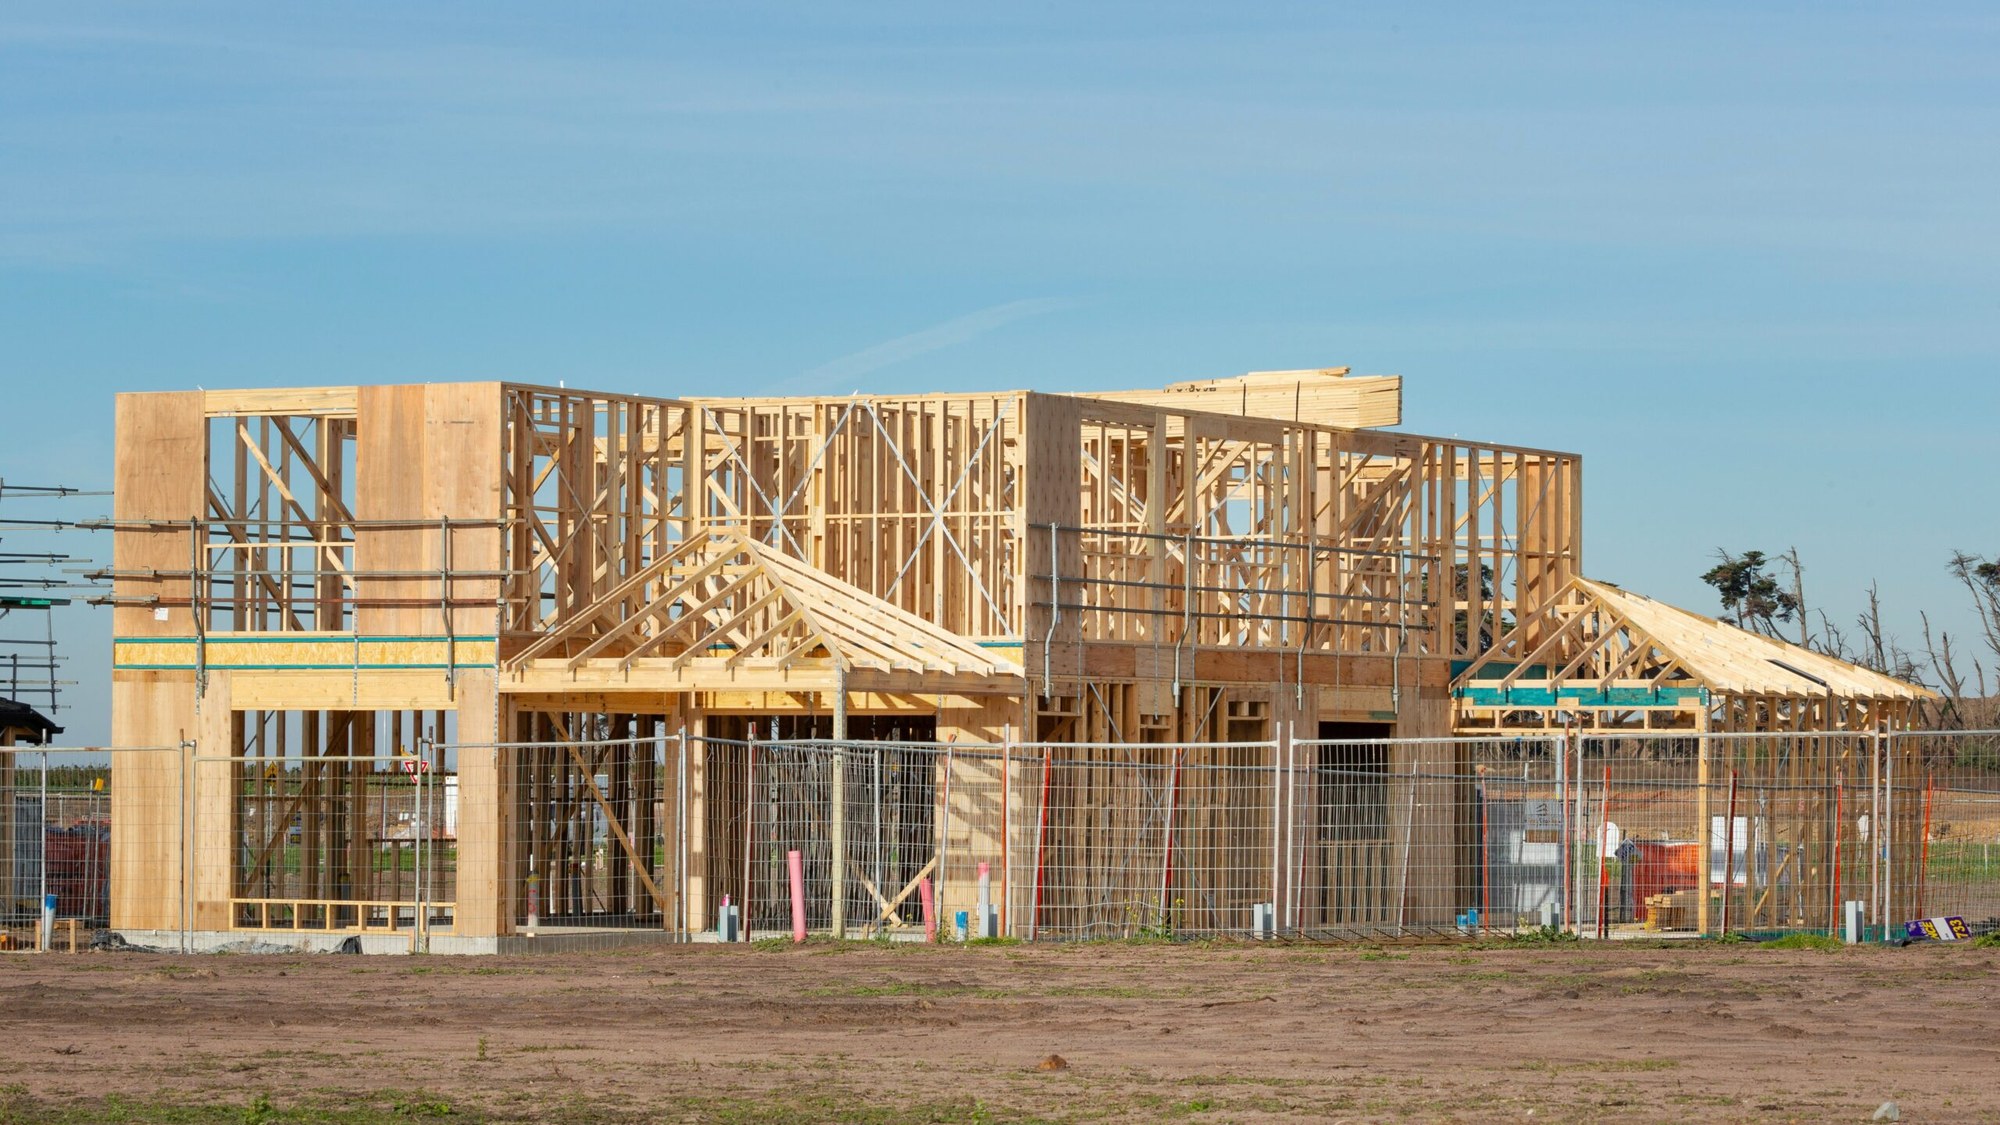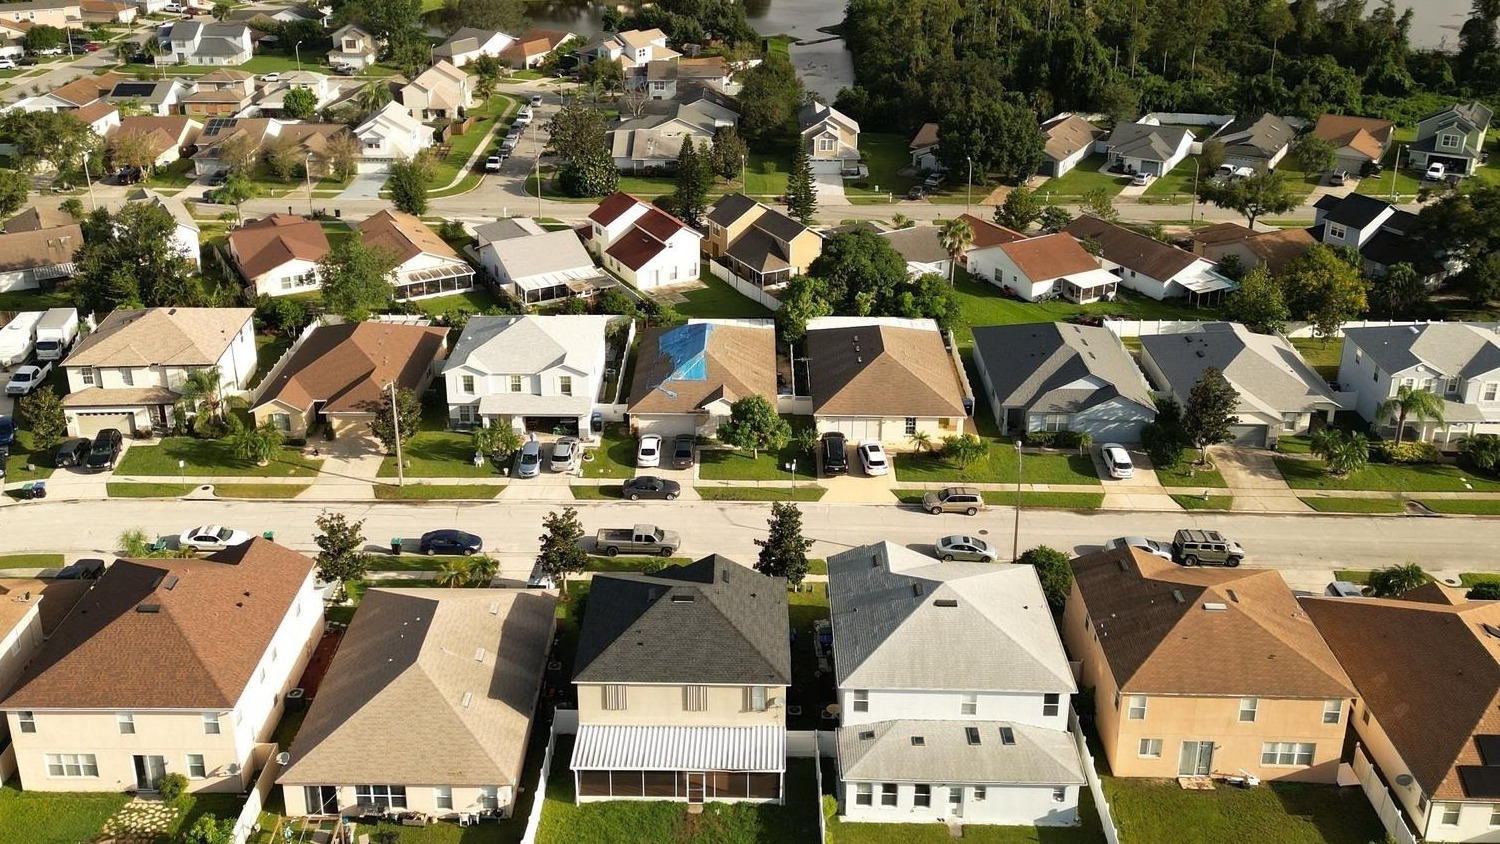
Redfin’s market snapshot shows 393,178 newly listed homes in August 2026, up 4.30 percent from August 2025. That is the number of homes sellers put on the market during the month, and it outran the 291,769 homes that sold in the same month by about 100,000.
The gap is the supply story of the month. More homes came to market than were sold, which is how inventory builds, buyers gain room to negotiate and sellers begin to cut prices.
393,178 listings against 291,769 sales
Redfin’s August 2026 data summary lists three counts for the month: 393,178 newly listed homes, up 4.30 percent from a year earlier, 291,769 homes sold, and a median sale price of $398,596. The U.S. housing market page repeats the new-listing count and growth rate, and labels the data as all home types over the calendar month.
Dividing one by the other gives about 1.35 new listings for every sale. That ratio is arithmetic on Redfin’s two figures, not a number Redfin publishes, and it carries a caveat: homes listed in August do not all sell in August, and many sales that closed in the month were listed earlier. As a rough read of direction, though, a ratio above one means the pool of unsold homes was being added to faster than it was drawn down.
In absolute terms, 393,178 listings minus 291,769 sales leaves 101,409 more homes arriving than selling during the month. The subtraction compares two flows over the same calendar month, but it is not a change in inventory, because withdrawn listings and sales of homes listed earlier also move the stock.
New listings are a flow, inventory is a stock
The 393,178 is a flow, a count of arrivals during one month. It is not the number of homes for sale. That stock is a separate Redfin figure: 1,534,918 active listings nationwide, up 2.7 percent from a year earlier, with a supply of four months.
Keeping the two apart avoids a common misreading. New listings can rise 4.30 percent while total listings rise 2.7 percent, because homes that sell or are withdrawn leave the stock as new ones enter. Annual growth in arrivals running ahead of annual growth in the stock fits a market in which homes are also leaving at a steady clip.
Redfin’s counts are also a different series from the one the National Association of Realtors uses. NAR’s August release put total existing-home inventory at 1.62 million units, up 5.9 percent from a year earlier and equal to 4.9 months of supply at the August sales pace. Redfin’s 1.53 million and NAR’s 1.62 million describe the same market through different samples and should not be netted against each other.
What a 21.1 percent price-cut share does to a listing glut
Rising supply shows up in pricing behavior. Redfin’s report of September 30 found that 21.1 percent of U.S. home sellers dropped their asking price in the four weeks ending September 20, against 19.8 percent a year earlier. The share is the highest for that point in the calendar in Redfin’s records, which go back to 2022, and Redfin headlined the finding as a strong buyer’s market.
The cuts were concentrated in some metros. Denver led at 30.9 percent, followed by Indianapolis at 29.9 percent, San Antonio at 26.8 percent, Dallas at 26.6 percent and Austin at 26.1 percent. At the other end, San Francisco recorded 9.6 percent, Newark 12.2 percent and Chicago 13.3 percent, so the balance between listings and buyers differs sharply by market. A national count of new listings blends all of these local balances into one number.
Asad Khan, a senior economist at Redfin, said in the report that sellers who sell quickly are the ones getting savvier about pricing from day one. In a market where new listings are outpacing sales, a home priced above what buyers will pay sits, and the sitting itself invites a cut.
Sales did not keep pace with the new supply
Redfin’s sales count of 291,769 is the other side of the balance. Its news-page summary records sales as slightly lower than a year earlier, while listings rose. The NAR report points the same way: existing-home sales fell 2.0 percent in August to a seasonally adjusted annual rate of 3.98 million, which is 1.2 percent below August 2025, even as NAR’s inventory count rose.
The result is the pattern a market takes on when supply grows faster than demand: more listings, more cuts, a modest rise in the median price, and slower closings. Redfin’s median sale price still rose 2.20 percent in August, so the supply build has not yet pulled prices down in the national data.
Whether the arrival rate keeps outpacing sales will show in Redfin’s September data, published after the month closes. The measurable facts for August stand on Redfin’s own counts: 393,178 homes newly listed, 4.30 percent more than a year before, against 291,769 sold.
Property-tax and home-cost relief for homeowners and renters
Property-tax relief, utility help and home-repair assistance are normally applied for, not granted automatically, and each program carries its own filing window. Homeowners and renters who miss a window generally wait until the next cycle.
The Senior Property Tax & Home-Cost Relief Kit is an 11-page download that lays out the 5 kinds of property-tax relief, the circuit-breaker credit that includes renters, and help with heating, cooling and home repairs, plus an application log and renewal calendar.
See what the relief kit lays out for property-tax and home-repair help →
Produced with AI assistance, this report’s listing counts, percentages and dates were checked against the Redfin and NAR pages cited, read on October 4, 2026.