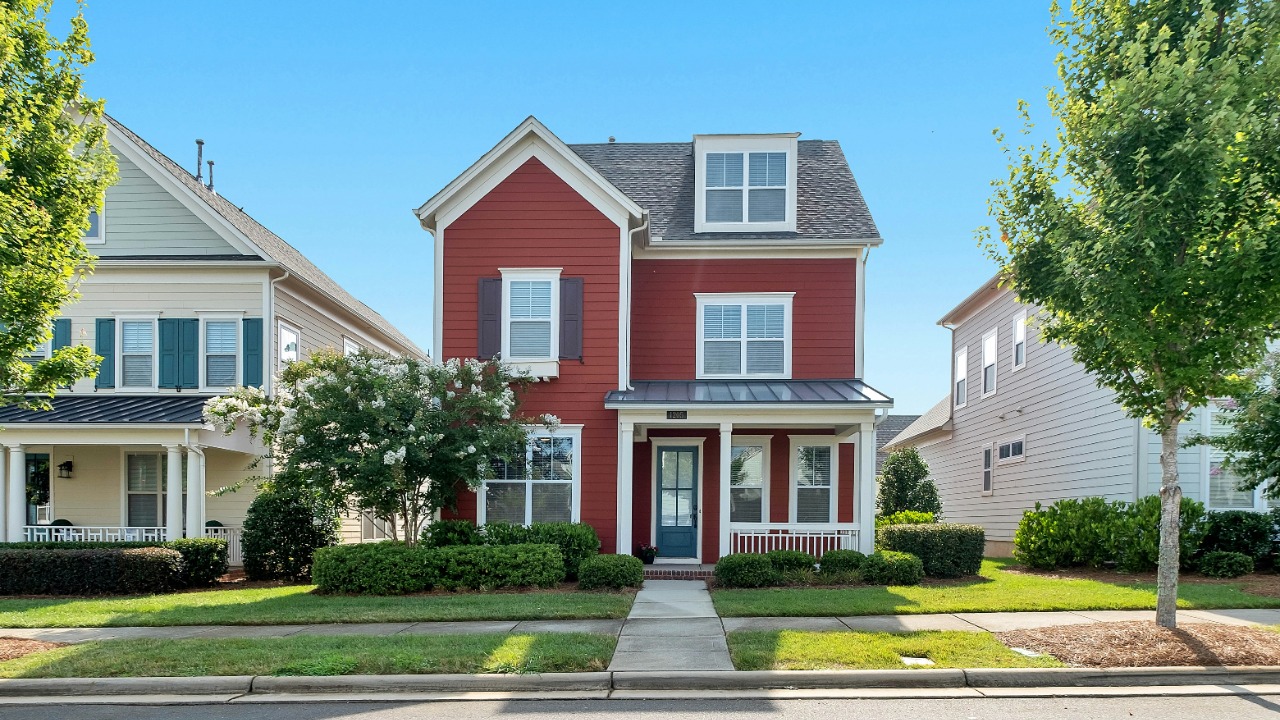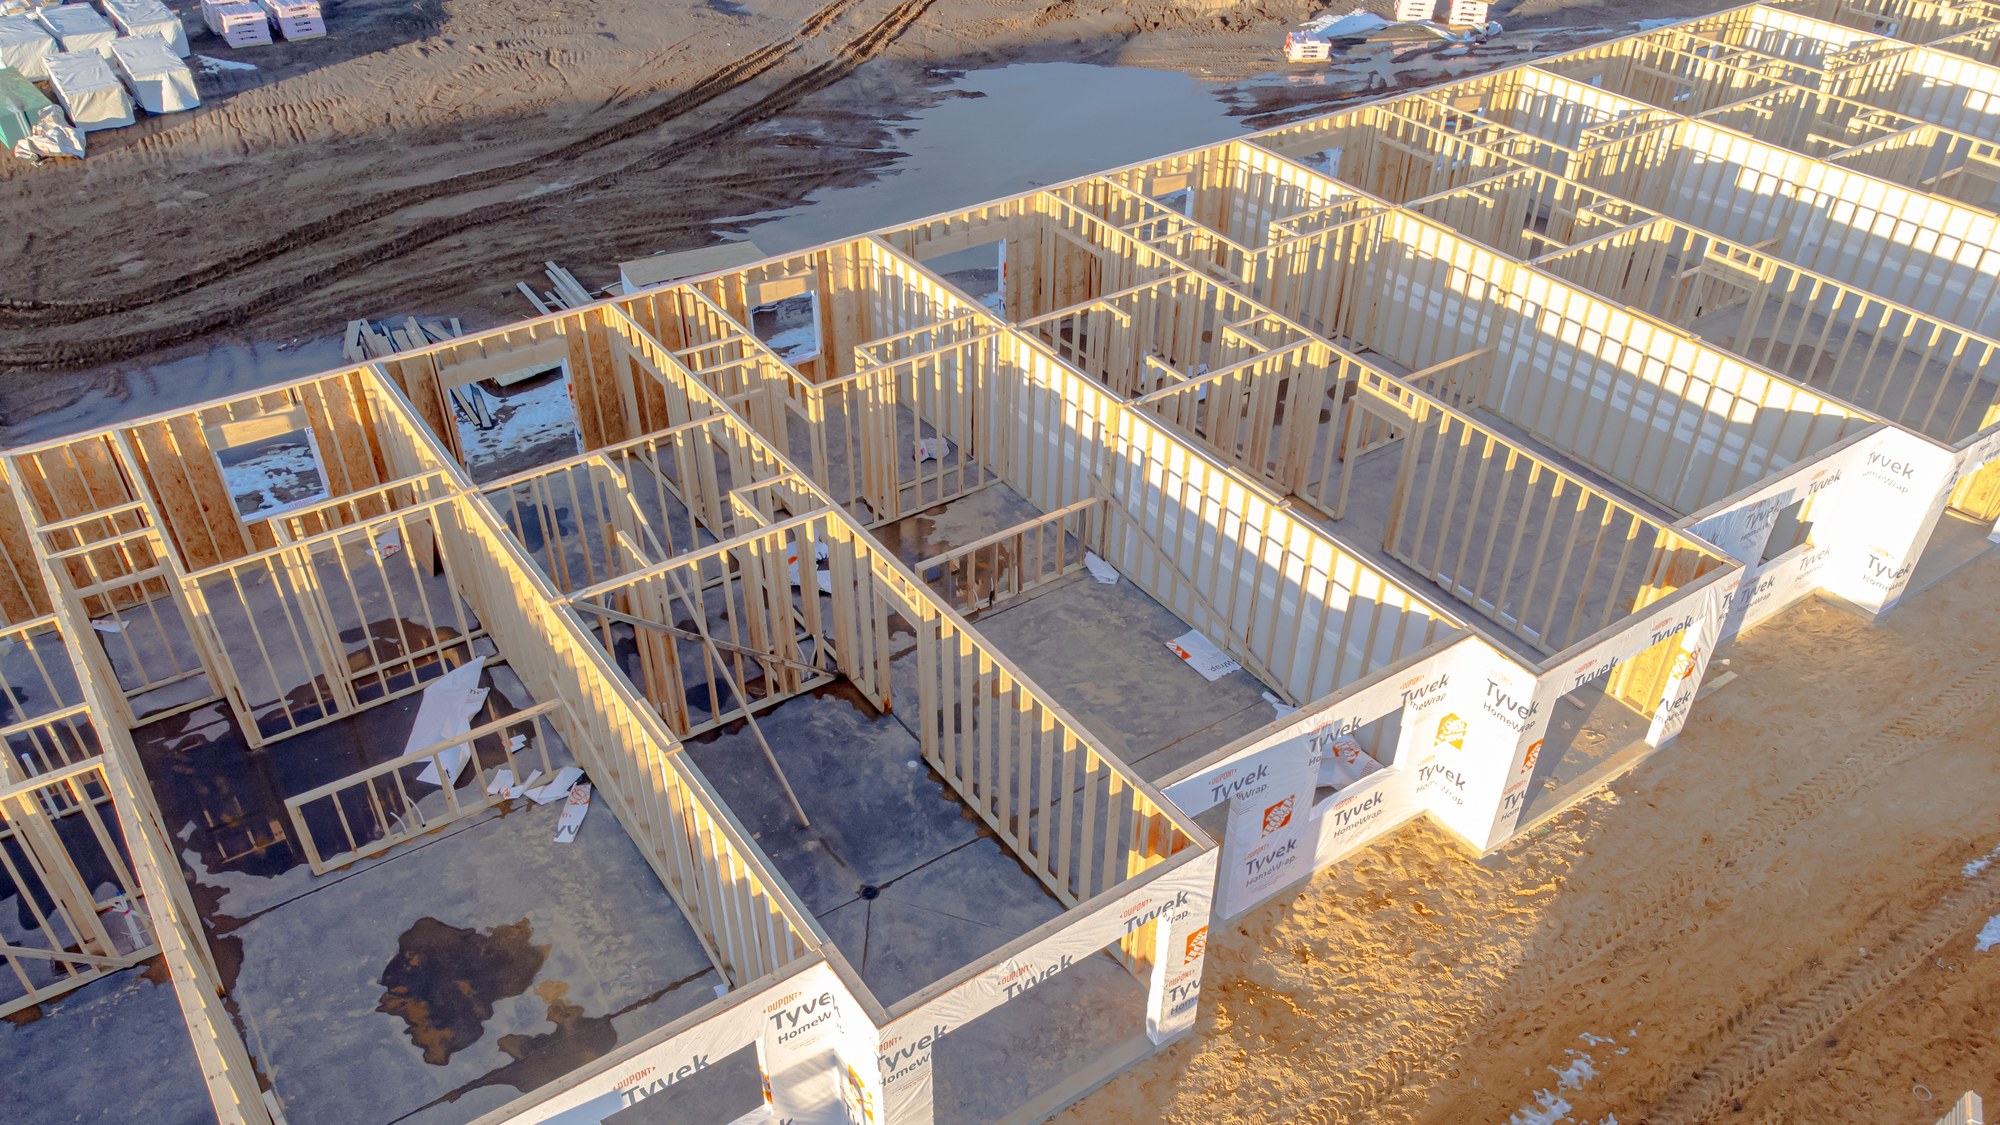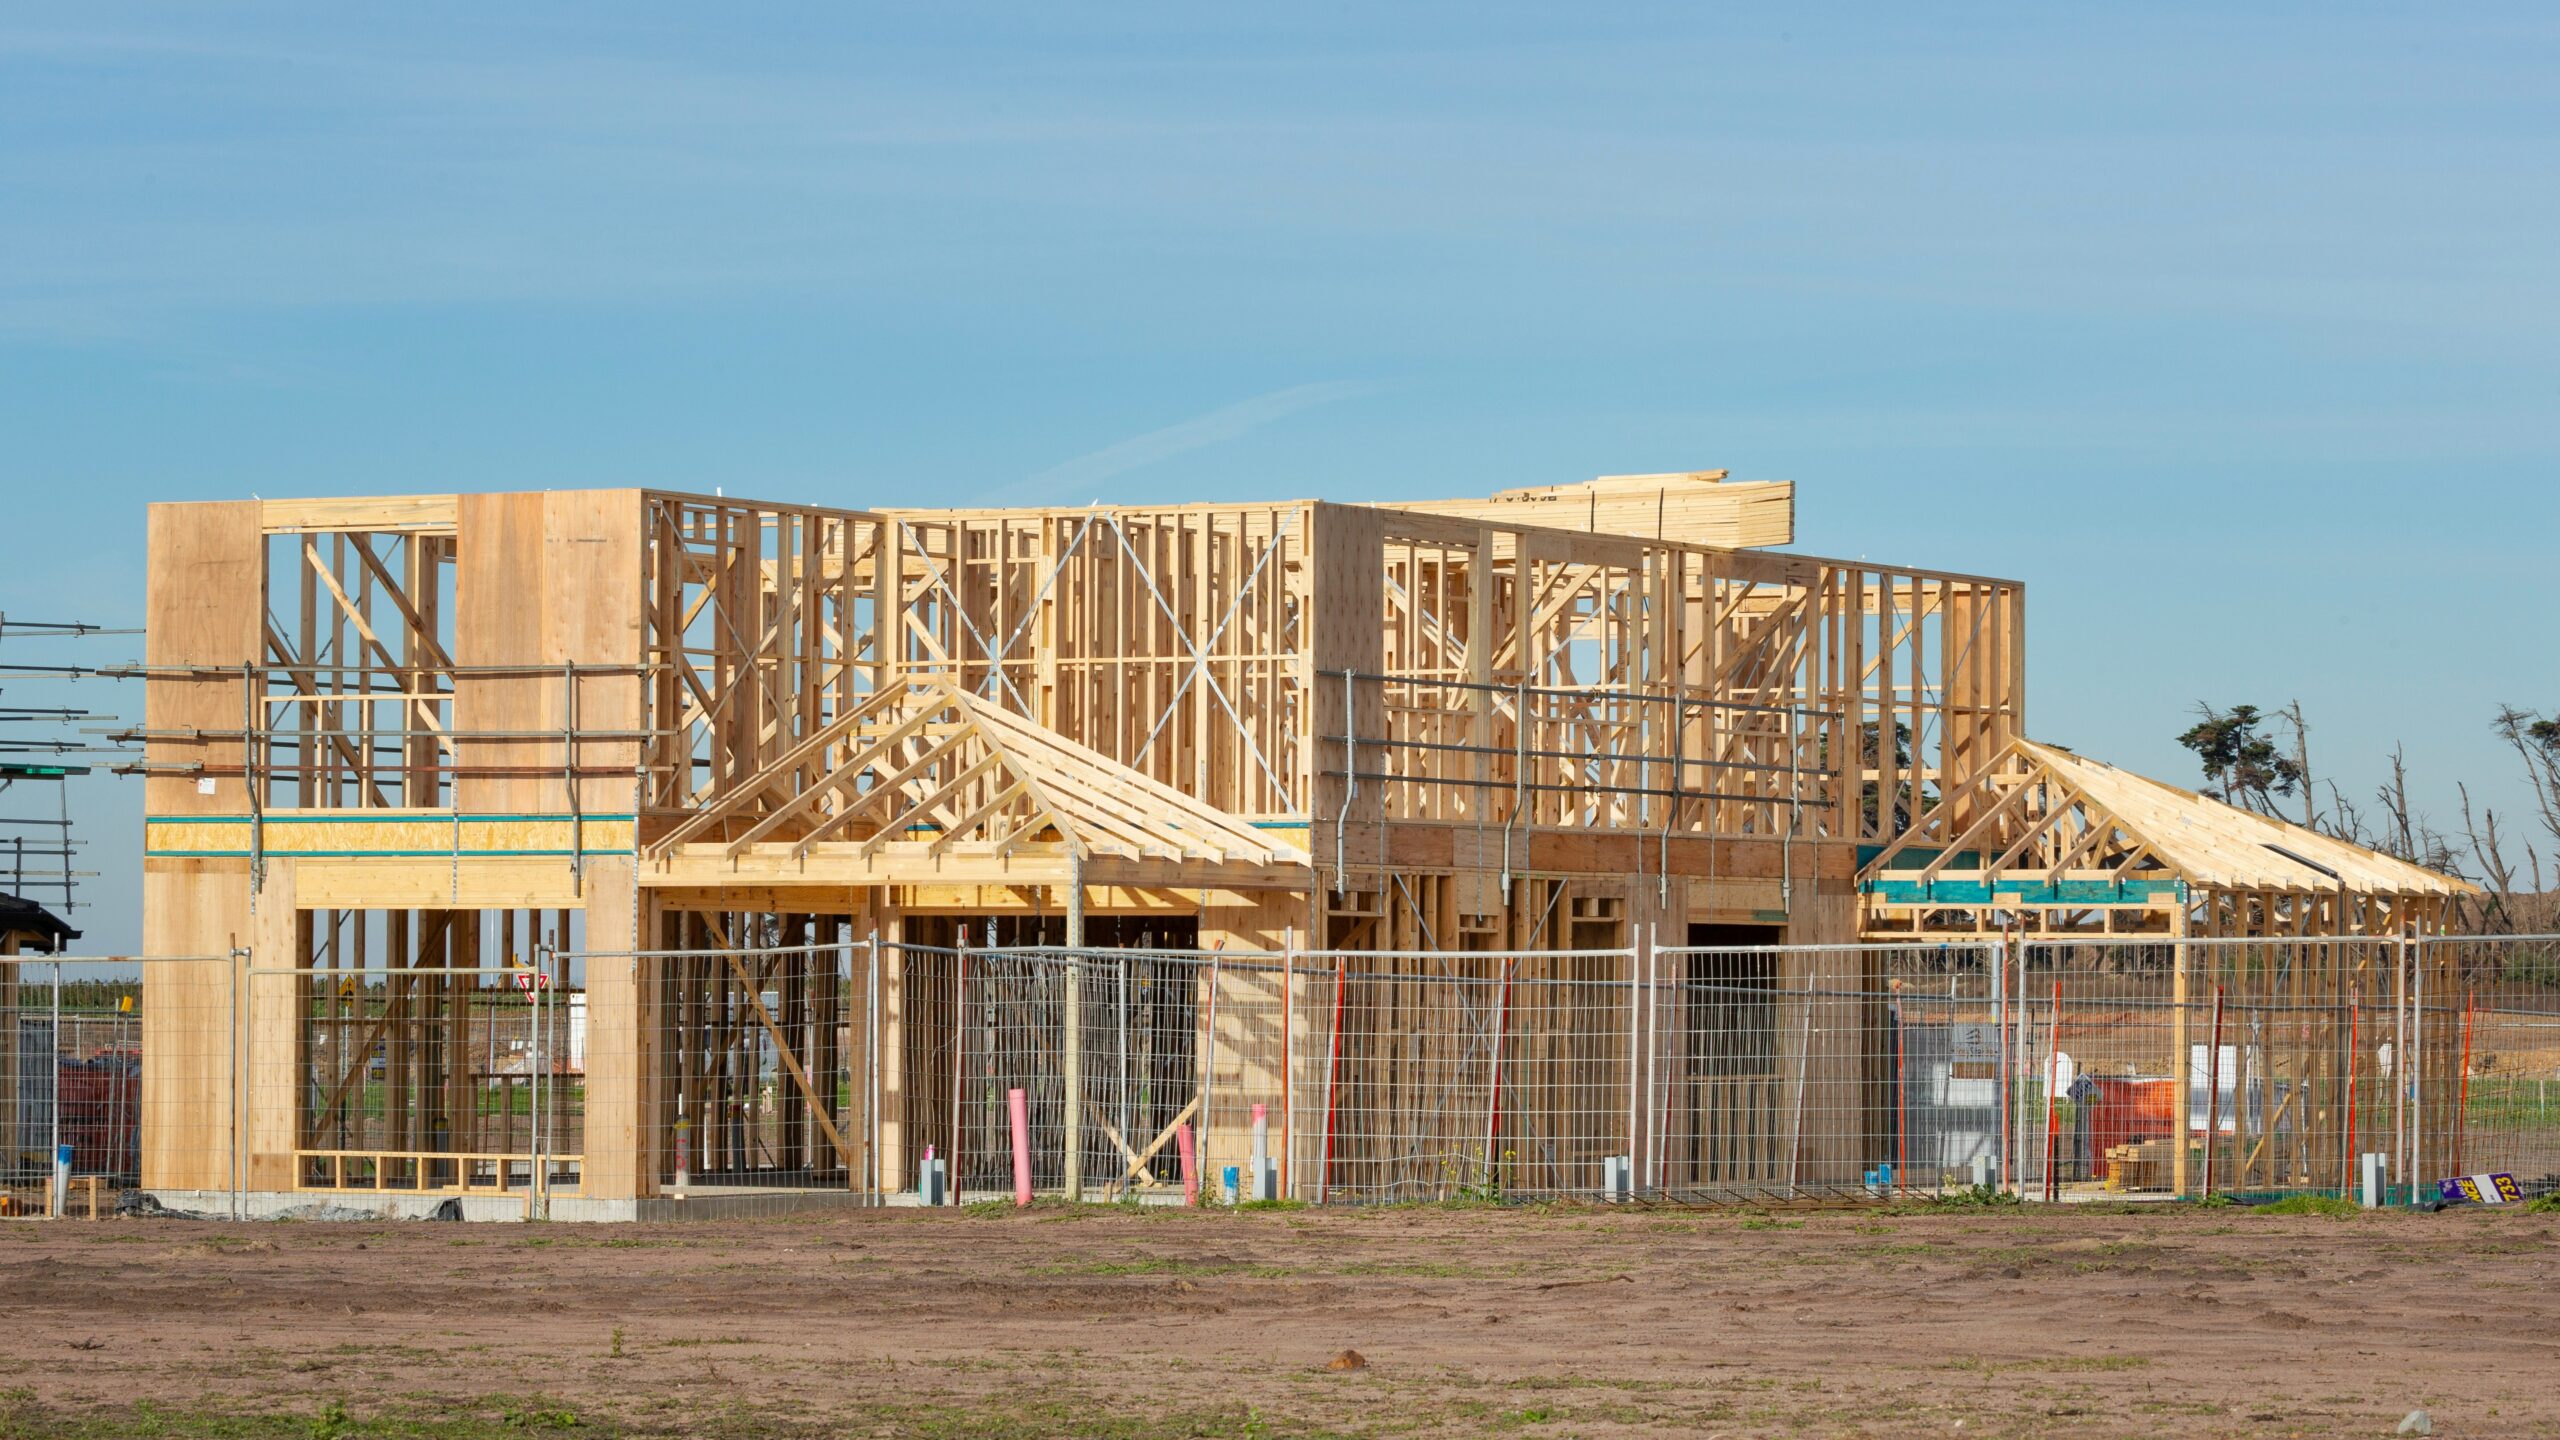
Local governments authorized new homes in August at a seasonally adjusted annual rate of 1,394,000, the Census Bureau and the Department of Housing and Urban Development reported. That is 2.7% below July’s revised 1,433,000 and 3.5% above the 1,347,000 pace of August 2025. The figures come from the August New Residential Construction release, published Sept. 17.
A building permit is the green light a builder needs before breaking ground, so permits show what is coming months before it is built. The rate is not a count of August permits. It takes one month’s seasonally adjusted pace and states it as if it held for a year.
For anyone watching rent, a home price or the cost of staying put, the question is whether builders are signaling more supply. Permits at 1.39 million a year are up from a year ago but down from July. Builders are neither pulling back sharply nor surging.
Retirement deadlines, in your inbox: Miss an enrollment or claim deadline and the money can be gone. Join the Retirement Money Brief and we’ll send you our Property Tax & Utility Relief Finder as a welcome gift.
Get the Brief + the relief finder →
We may earn a commission from links on this page.
Houses versus apartments
Single-family permits came in at 878,000, down 1.8% from July’s revised 894,000, according to the Census release. Permits for buildings with five or more units ran at 467,000, down 3.1% from July. Permits for two-to-four-unit buildings were 49,000, down 14.0%.
Add the three together and you get the 1,394,000 total. Single-family homes made up about 63% of the permits, and large apartment buildings about a third. Duplexes, triplexes and fourplexes are the smallest slice and fell the most in percentage terms.
Where permits fell and rose
The South, the biggest building region, was close to flat. It authorized 745,000 homes at an annual rate, down 0.4% from July. The West came in at 313,000, up 1.6%.
The Midwest fell 7.6% to 208,000. The Northeast fell the most, 15.8%, to 128,000. Month-to-month swings in the smaller regions can be large, so one month does not make a trend.
Permits issued but not yet built
A permit is not a house. The Census Bureau also counts homes that were authorized by a permit but had not yet started construction at the end of August. That backlog was 280,000 units, up 0.7% from July and up 12.9% from August 2025.
Of those, 148,000 were single-family, unchanged from July, and 128,000 were in buildings with five or more units. In the South, 164,000 were waiting to start, compared with 66,000 in the West, 26,000 in the Midwest and 24,000 in the Northeast. A growing backlog can mean builders are waiting on financing, demand or materials. The Census release does not say why.
Eight months of 2026
The August rate sits in the middle of this year’s range, according to the release tables. Seasonally adjusted permits ran at 1,393,000 in January, 1,540,000 in February, 1,363,000 in March, 1,423,000 in April, 1,410,000 in May, 1,374,000 in June and 1,433,000 in July after revision. February was the high. March was the low.
The seasonally adjusted rate smooths out the calendar. Counted without adjustment, localities issued permits for 117,400 homes in August, including 74,000 single-family houses and 39,200 units in buildings with five or more apartments. Through the first eight months of the year, permits totaled 969,100, down 0.1% from 970,100 in the same stretch of 2025.
That year-to-date comparison tells a different story from the 3.5% year-over-year gain in August alone. Single-family permits are down 2.5% for the year, to 620,900 from 636,500.
How firm the number is
Permit estimates come from a sample that is not random, so the Census Bureau does not publish sampling-error margins for them. The release says preliminary seasonally adjusted permit estimates are revised, on average, by 3.8% or less. July’s figure was already revised to 1,433,000.
Housing starts, the next step after a permit, were 1,275,000 in August, the same release shows. That is 2.6% below July’s revised 1,309,000 and 1.2% below August 2025’s 1,291,000, though the Census Bureau says neither change is statistically significant. Starts run below permits.
Homes already under construction
The Census Bureau also tracks the stock of homes in the pipeline. At the end of August, 1,271,000 homes were under construction, up 0.3% from July and down 3.2% from August 2025, the release says. The year-over-year drop is outside the margin of error.
Put the pieces side by side. Permits are slightly ahead of last year for the month, the year-to-date total is flat, and fewer homes are being built at any one time than a year ago. That is a market holding steady, not one racing to add supply.
What comes next
The Census Bureau’s release schedule lists the September report for Oct. 20 at 8:30 a.m. Eastern. It will show whether the 1,394,000 August pace was a pause or the start of a slide, and the August figure may be revised when it does.
New supply moves slowly. Homes permitted this fall will not be on the market for many months, so anyone with housing costs today still faces this year’s property tax and utility bills, whatever builders do next.
Which of this year’s home costs can still be cut?
Builders’ permits will not lower this winter’s heating bill or next year’s property tax assessment. Relief for older homeowners comes through applications, and many programs renew on a yearly cycle that is easy to miss.
The Senior Property Tax & Home-Cost Relief Kit covers heating, cooling and home-repair help, along with the property-tax freezes and breaks for older homeowners. It includes an application log and renewal calendar for keeping each program on schedule.
Track heating, cooling and home-repair help with the Home-Cost Relief Kit’s renewal calendar →
More Financial Reading
- 15 Ways Retirees Are Tapping a Record $14.9 Trillion in Home Equity
- 21 Ways to Stretch a $2,087 Social Security Check
- The New $6,000 Senior Deduction and 14 More Tax Moves for Retirees
This article was produced with the assistance of AI and reviewed by the editorial team.