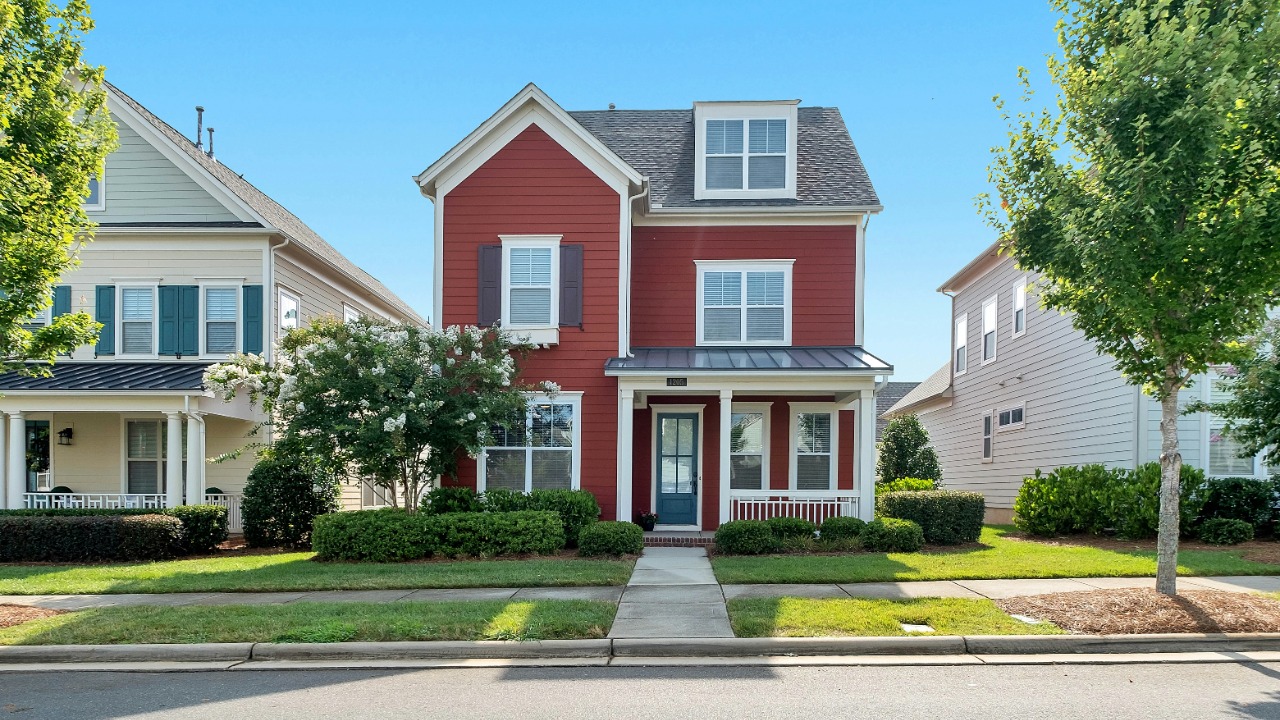
Homebuyers gained a small but measurable edge in May as existing-home sales climbed 3.2 percent to a seasonally adjusted annual rate of 4.17 million, the fastest monthly pace since December. The National Association of Realtors reported the gain on June 9, 2026, crediting a rise in new listings for pulling some sidelined buyers back into the market. The result beat economist expectations and signals that inventory pressure, not mortgage-rate relief, is driving the spring rebound.
Rising listings, not falling rates, drove the May sales jump
The tension behind this report is straightforward: sellers are listing homes in greater numbers, but borrowing costs have not dropped enough to unleash broad demand. The NAR existing-home release showed the 3.2 percent monthly increase pushed the annualized sales rate to 4.17 million units. That figure topped the consensus forecast compiled by FactSet economists, according to an Associated Press report, suggesting the market performed better than Wall Street anticipated even with rates above 6 percent.
The practical question for buyers and sellers is whether more supply will slow price growth. A sustained rise in new listings can shift bargaining power toward buyers by giving them more options and reducing bidding wars. If inventory keeps climbing at the pace seen in recent months, price moderation could follow within two quarters, even without a meaningful drop in mortgage rates. That hypothesis rests on a simple supply-and-demand mechanism: when the number of homes for sale grows faster than the number of qualified buyers, sellers lose pricing leverage.
For now, though, the data shows sales volume rising alongside supply, which means demand has not stalled. Buyers appear willing to act when they find a home that fits their budget, even at elevated borrowing costs. The risk is that this willingness fades if rates tick higher or if prices continue to climb through the summer.
NAR data and FactSet consensus confirm the five-month high
Two independent data streams back the headline claim. NAR’s own release, distributed through the GlobeNewswire platform, confirmed the 3.2 percent monthly gain and the 4.17 million SAAR. The Associated Press separately verified both figures and added that the May pace was the fastest since December, placing the gain in a clear seasonal and cyclical context.
FactSet’s economist consensus provided the expectation benchmark. The fact that actual sales exceeded that consensus matters because it suggests the inventory increase is translating into closed transactions, not just window shopping. When listings rise but sales do not follow, it typically signals weakening demand or mispricing. The May data shows the opposite pattern: more homes hit the market, and more buyers signed contracts.
Lawrence Yun, NAR’s chief economist, has pointed to the listing increase as evidence that homeowners who had been reluctant to give up low-rate mortgages are beginning to move. Life events such as job changes, growing families, and retirements eventually override the financial incentive to stay put, and the May numbers suggest that dynamic is gaining traction. As more of these owners decide to sell, the so‑called “lock‑in effect” that has constrained supply since the pandemic could gradually ease.
Inventory depth and rate trajectory remain open questions
Several gaps in the available data will determine whether May’s improvement marks a turning point or just a seasonal blip. The first is how deep the inventory pool really is. A single month of stronger listings can temporarily boost options for buyers, but a durable shift requires multiple months of net additions to the for‑sale stock. If new listings flatten while sales stay firm, the market could quickly revert to the tight conditions that defined much of the past two years.
The second unknown is the path of mortgage rates through the rest of 2026. The May figures show that buyers can and will transact with rates above 6 percent when they see suitable homes. But there is likely a ceiling beyond which affordability breaks down, especially for first‑time buyers who lack existing home equity. Should borrowing costs edge higher from here, some of the demand that surfaced in May could evaporate, leaving sellers with longer marketing times and a renewed need for price cuts.
Regional patterns will also shape how this national trend feels on the ground. Markets that saw the sharpest price appreciation in 2021 and 2022 may be more vulnerable to any renewed affordability squeeze, while areas that remained relatively affordable could continue to attract buyers migrating from high‑cost metros. In both cases, the interplay between local job growth, wage gains, and housing supply will matter more than any single national indicator.
For now, the takeaway is modest but meaningful: more homeowners are putting properties on the market, and buyers are responding despite still‑high borrowing costs. If listings continue to build through the summer while rates remain roughly stable, the balance of power could slowly tilt away from the extreme seller’s market of recent years toward something closer to equilibrium. That would not necessarily translate into widespread price declines, but it could mean slower appreciation, fewer bidding wars, and slightly more negotiating room for buyers who have been on the sidelines waiting for an opening.