A New York City teacher earning $65,000 a year wants to move closer to her school. A nurse needs a bigger apartment after a second child. A restaurant worker’s landlord won’t fix the heat. All three face the same brutal arithmetic: signing a new lease in the same city would require roughly $70,000 more in annual income than they currently earn, according to a recent analysis by Realtor.com.
That figure represents the chasm between what tenants pay under existing leases and what the open market now demands. It has effectively frozen millions of renters in place, turning the simple act of moving across town into a financial event on par with buying a car or wiping out a student loan balance.
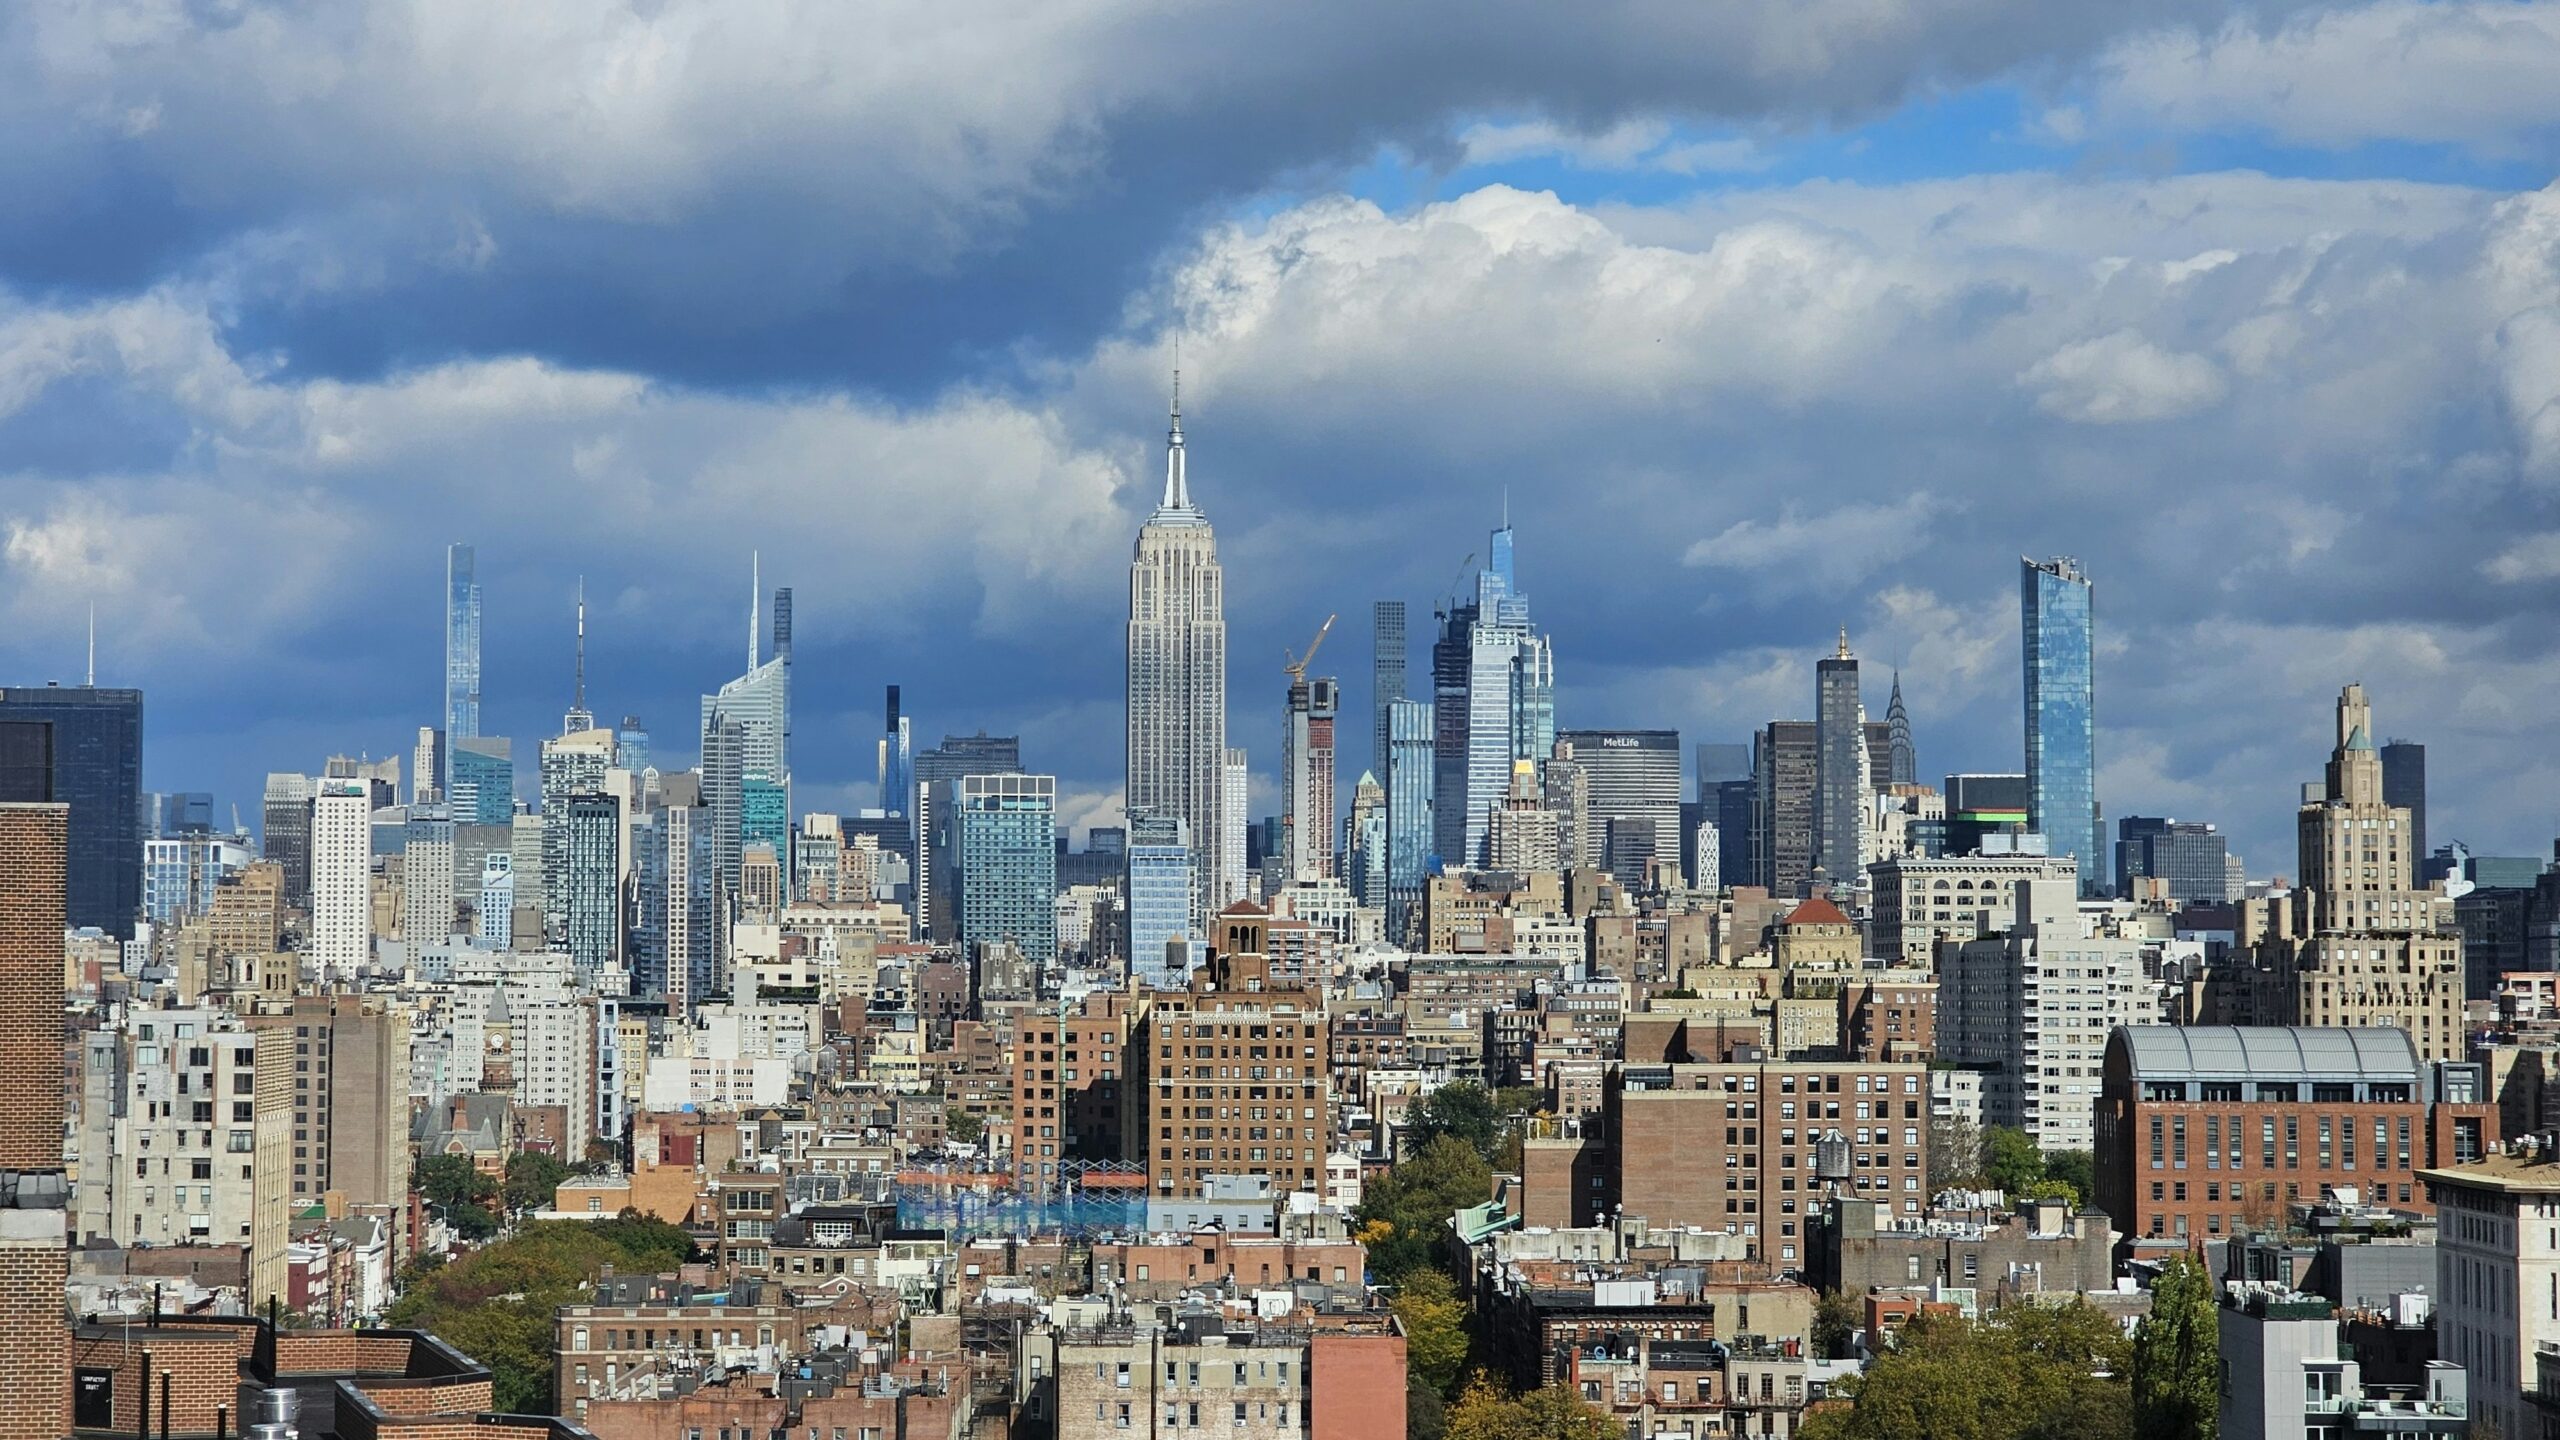
The median household income for New York City renters sits at approximately $65,000 a year, based on 2024 American Community Survey estimates from the U.S. Census Bureau. Realtor.com’s analysis suggests that affording a new lease at current asking rents would require an income closer to $135,000, using the standard benchmark of spending no more than 30 percent of gross income on housing. That implies a median market rent north of $3,300 a month, a figure that tracks with current listings across much of Manhattan, Brooklyn, and parts of Queens.
A market with almost nothing available
The affordability crisis is inseparable from a supply crisis. The 2023 New York City Housing and Vacancy Survey, conducted for the city’s Department of Housing Preservation and Development, found the rental vacancy rate had fallen to 1.4 percent, the lowest reading in the survey’s six-decade history. Fewer than two out of every hundred apartments sit empty at any given time. HPD called the finding a demand for “urgent action,” and as of spring 2026, no newer citywide vacancy survey has been released.
That scarcity hands enormous pricing power to landlords. When a unit opens up, dozens or even hundreds of applicants may compete for it, pushing asking rents well above what the previous tenant paid. Realtor.com’s model used Census Bureau data on median contract rent as a baseline, then projected forward to estimate what renters would face on the open market today. The resulting income gap, about $70,000, captures how far current earnings fall short of what a new lease requires.
New York is not the only expensive city where renters feel trapped, but the scale of the gap here dwarfs most peers. Realtor.com’s broader national analysis found that renters in cities like Los Angeles, Boston, and Miami also face significant cost jumps when moving, but none approached the size of New York’s shortfall.
Rent-stabilized tenants face a particular trap
For the roughly one million households living in rent-stabilized apartments, a figure tracked by the NYC Rent Guidelines Board, the lock-in effect is even more acute. A report from the NYC Comptroller’s office found that vacancies in the regulated housing stock are scarcer than in the broader market. When a stabilized tenant does leave, landlords can often reset the rent sharply upward, sometimes pushing the unit out of the regulated system entirely.
The result is a standoff. Tenants stay in apartments they may have outgrown, or that need repairs, because nothing comparable exists at a price they can pay. Landlords, meanwhile, may hold vacant regulated units off the market while pursuing renovations or deregulation strategies. Both sides of the equation reduce the number of apartments actually available to people searching for a home.
Why the $70,000 number deserves some caution
Realtor.com has not published the full methodology behind its estimate, so the specific assumptions driving the rent projection are not available for independent review. The size of the income gap depends on how quickly asking rents rise relative to wages, and different models could produce meaningfully different numbers.
There is also a technical wrinkle worth noting. The Census Bureau introduced a processing change to its contract rent variable starting with the 2024 American Community Survey, which means precise year-over-year rent comparisons require extra care. The change does not invalidate the broader trend, but it adds a layer of uncertainty to any model built on that data.
And the $70,000 figure is a citywide median. The gap almost certainly varies by borough and neighborhood. A renter in the South Bronx paying $1,200 a month faces a different market reality than one in Brooklyn Heights paying $2,800, even though both would confront sticker shock on a new lease.
The costs that don’t show up in the data
Official surveys count occupied and vacant units, but they struggle to measure what housing researchers call “suppressed mobility”: the large number of households that want or need to move but simply cannot afford to. These are families doubling up with relatives, couples delaying children because they cannot find a bigger apartment, and tenants tolerating unsafe or overcrowded conditions because the alternative is financial ruin.
The NYC Rent Guidelines Board sets annual allowable increases for stabilized leases, and those decisions shape how much of the affordability gap falls on regulated versus free-market tenants. Even modest hikes on regulated apartments ripple outward when vacancy is this low, as the Comptroller’s analysis makes clear. Every stabilized tenant who gives up a lease adds one more unit to a market where landlords can charge whatever the traffic will bear.
Policy proposals stall against the timeline of construction
Responses under discussion in spring 2026 range from expanding rental voucher programs to rezoning neighborhoods for higher-density construction, but none will produce results quickly. Building new housing in New York City takes years of approvals, financing, and construction. Vouchers help individual families but do not add supply. For most of the city’s roughly two million renter households, the cheapest apartment in town remains the one they already have, and leaving it has become a luxury fewer and fewer can afford.