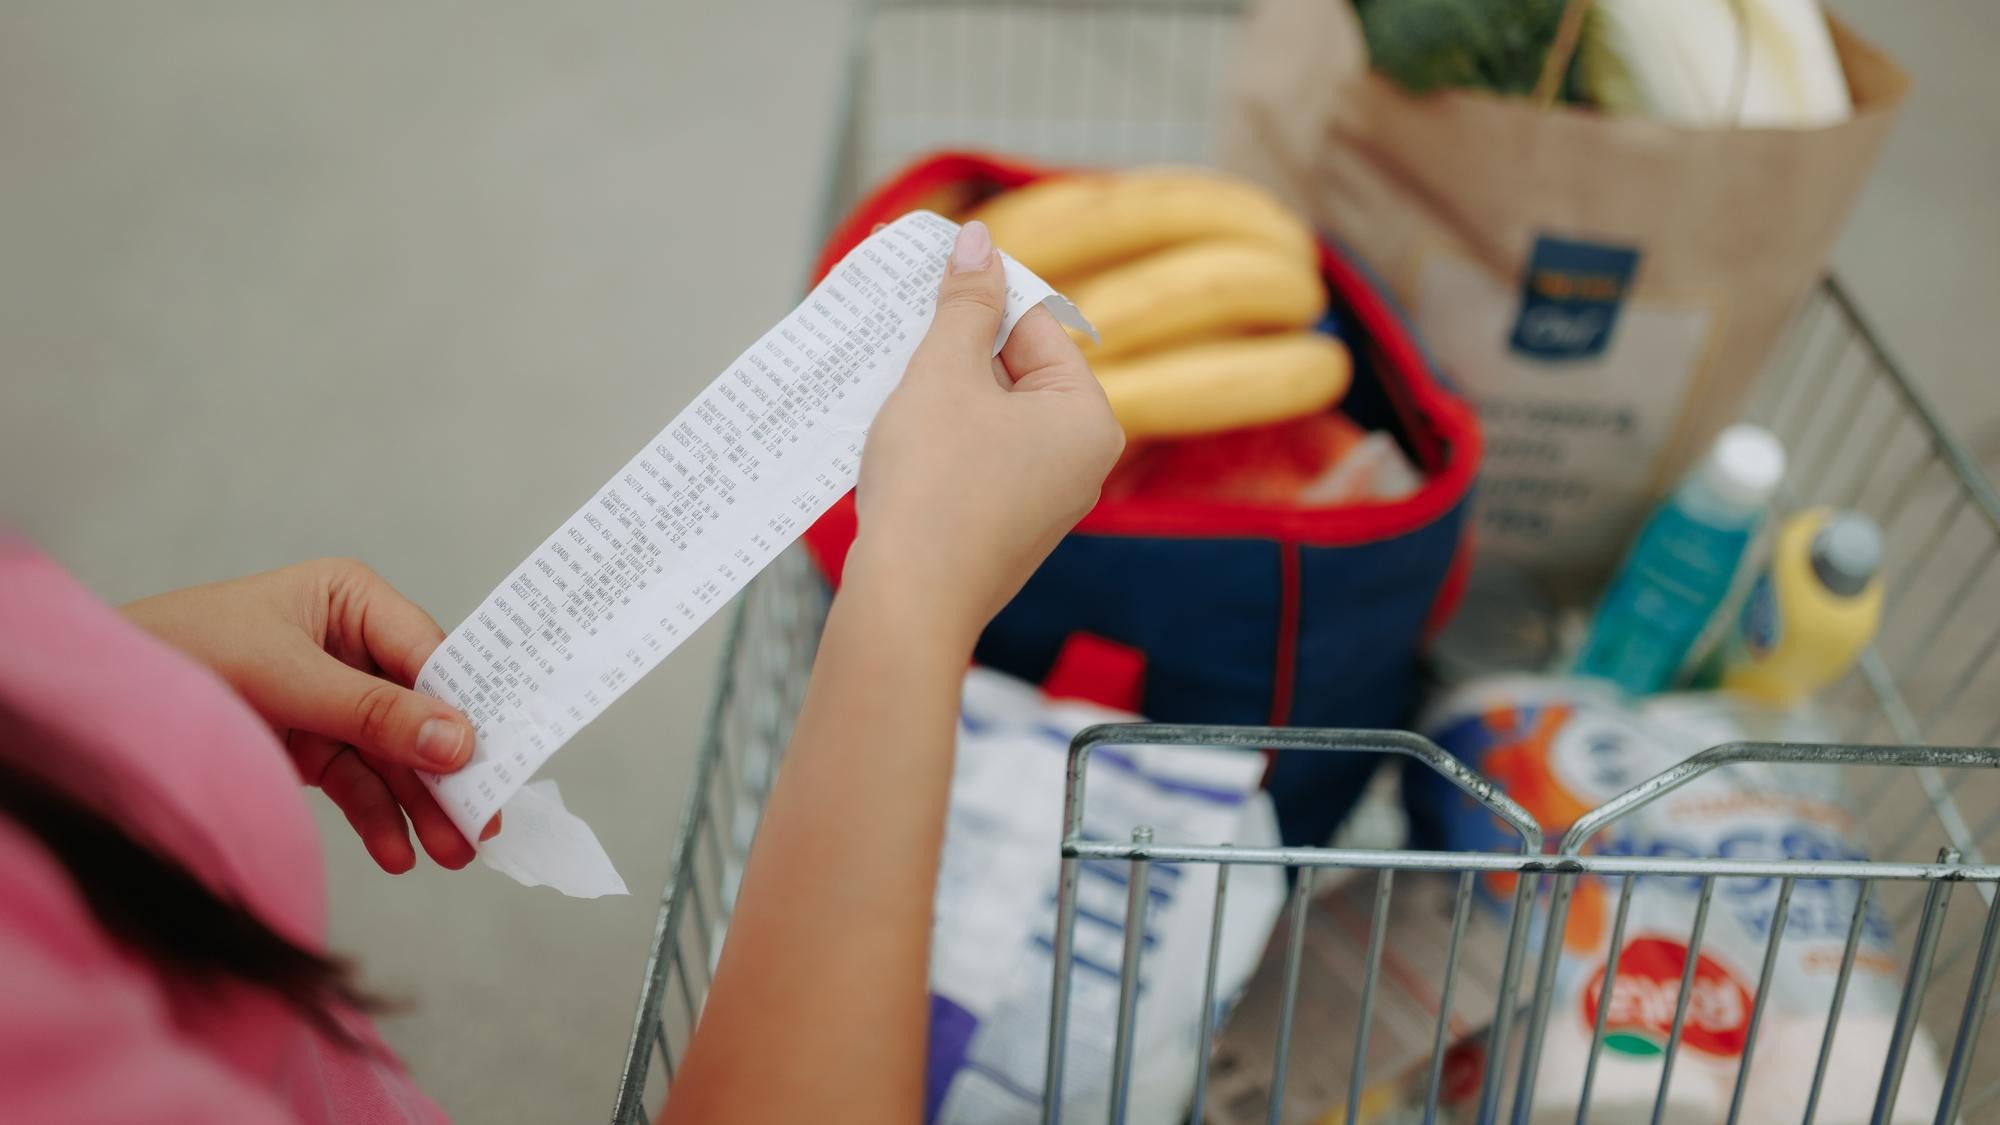
The average American household spent about $270 a week on groceries at the start of 2020. Walk into the same supermarket today, fill the same cart, and the tab is closer to $340. The difference is not a feeling or a political talking point. It is a number you can trace on a single federal chart, and it explains why “cooling inflation” has become one of the most misleading phrases in everyday economics.
The chart in question is the Bureau of Labor Statistics’ Consumer Price Index for food at home, the government’s broadest measure of supermarket prices. Tracked by the Federal Reserve Bank of St. Louis using BLS source data, the index has climbed roughly 25 percent from January 2020 through early 2026. Plot it and the shape is unmistakable: a steep ramp beginning in mid-2020, a brief acceleration through 2022, and then a plateau at the top. No descent. No return to the old baseline. Just a permanently higher shelf.
Slower inflation is not lower prices
This is the gap between the data economists celebrate and the receipts families dread. When the BLS reports that the annual rate of grocery inflation has dropped from its August 2022 peak of 13.5 percent to low single digits, that is genuinely good news in one narrow sense: prices are no longer surging at crisis speed. But a slower rate of increase is not a decrease. Every new month of even modest gains stacks on top of the increases that already happened, nudging the index further from where it stood before the pandemic.
Think of it as a staircase. Between 2020 and 2023, grocery prices sprinted up several flights. Since then, they have been climbing one step at a time. The pace changed. The altitude did not.
The USDA Economic Research Service reinforces this in its food price outlook, which translates BLS data into category-level projections. Even when projected year-over-year increases are small, they compound on top of the earlier surge. The overall level of grocery spending keeps edging higher, not lower.
Some aisles hurt more than others
The national average smooths over sharp differences by category. Eggs became a cultural flashpoint after successive avian influenza outbreaks drove prices to record highs; some relief arrived, but prices have not fully retreated to pre-outbreak levels. Meats, cereals, and bakery products have followed their own uneven paths. USDA retail scanner data, which captures price variation by food group and geography, shows that certain staples that spiked during the worst disruptions have partially corrected, while others, particularly shelf-stable processed foods, have held firm at elevated levels.
Geography sharpens the divide further. A shopper in a small town with one grocery store and a shopper in a city with five competing chains are paying different prices for the same box of cereal, shaped by local supply routes, transportation costs, and how fiercely retailers compete for foot traffic. The national headline may suggest broad stabilization, but the experience at the register varies block by block.
The corporate pricing question
One factor that remains only partially resolved is the role of corporate pricing decisions in keeping grocery bills elevated. In March 2024, the Federal Trade Commission published a report on grocery supply-chain disruptions that found some firms appeared to use rising input costs as cover to widen margins. Profits at major grocery retailers, the FTC noted, remained elevated even after supply pressures eased.
That report is now more than two years old, and no updated federal study of grocery-sector profit margins has been published since. Company-level financial disclosures offer only a partial view. Whether the margin dynamics the FTC identified still hold in 2026 is an open question, not a settled one, and anyone who claims certainty either way is outrunning the data.
What could push prices higher, or finally ease them
Several forces will determine whether the grocery price plateau holds, rises further, or begins to soften.
On the upside risk: trade policy is a live variable. Tariffs on imported food products and agricultural inputs, including fertilizer, have been a subject of active policy debate through the first half of 2026, and any escalation could feed directly into supermarket prices. Weather disruptions tied to drought, flooding, or another avian flu outbreak could spike individual categories with little warning. Diesel and freight costs, which ripple through every link of the food supply chain, remain tethered to volatile energy markets.
On the other side: if input costs continue to ease and competition among grocers intensifies, particularly as discount chains like Aldi and Lidl expand their U.S. footprints, the pace of new increases could slow further. Several major retailers have already leaned into price-matching programs and private-label expansion to attract cost-conscious shoppers, a dynamic that puts at least modest downward pressure on branded goods.
But none of these scenarios point toward a return to 2019 price levels. Broad deflation across the entire grocery basket would require a combination of forces that virtually no mainstream economic forecast anticipates.
When paychecks and grocery receipts do not match
For households whose wages have not kept pace with a cumulative 25 percent increase in grocery costs, the arithmetic is blunt. Lower-income families, who devote a larger share of their budgets to food, absorb the hit most directly. Data from the BLS Consumer Expenditure Survey shows that food accounts for roughly 13 percent of total spending among the lowest income quintile, compared with about 8 percent for the highest. A price plateau that barely registers in one household’s budget can force real trade-offs in another: store brands instead of name brands, smaller packages, meals stretched or skipped.
If real wages eventually outpace food prices, the burden of the higher baseline may gradually ease even without shelf prices falling. But that has not happened broadly enough to close the gap. The latest BLS real earnings data suggest the race between paychecks and grocery receipts remains tight, with many workers still running behind.
The chart tells a story that no single inflation number can capture. Prices went up. They stayed up. And for tens of millions of Americans pushing a cart through the supermarket in 2026, “cooling inflation” is a phrase that does not match what they pull out of their wallets at checkout.