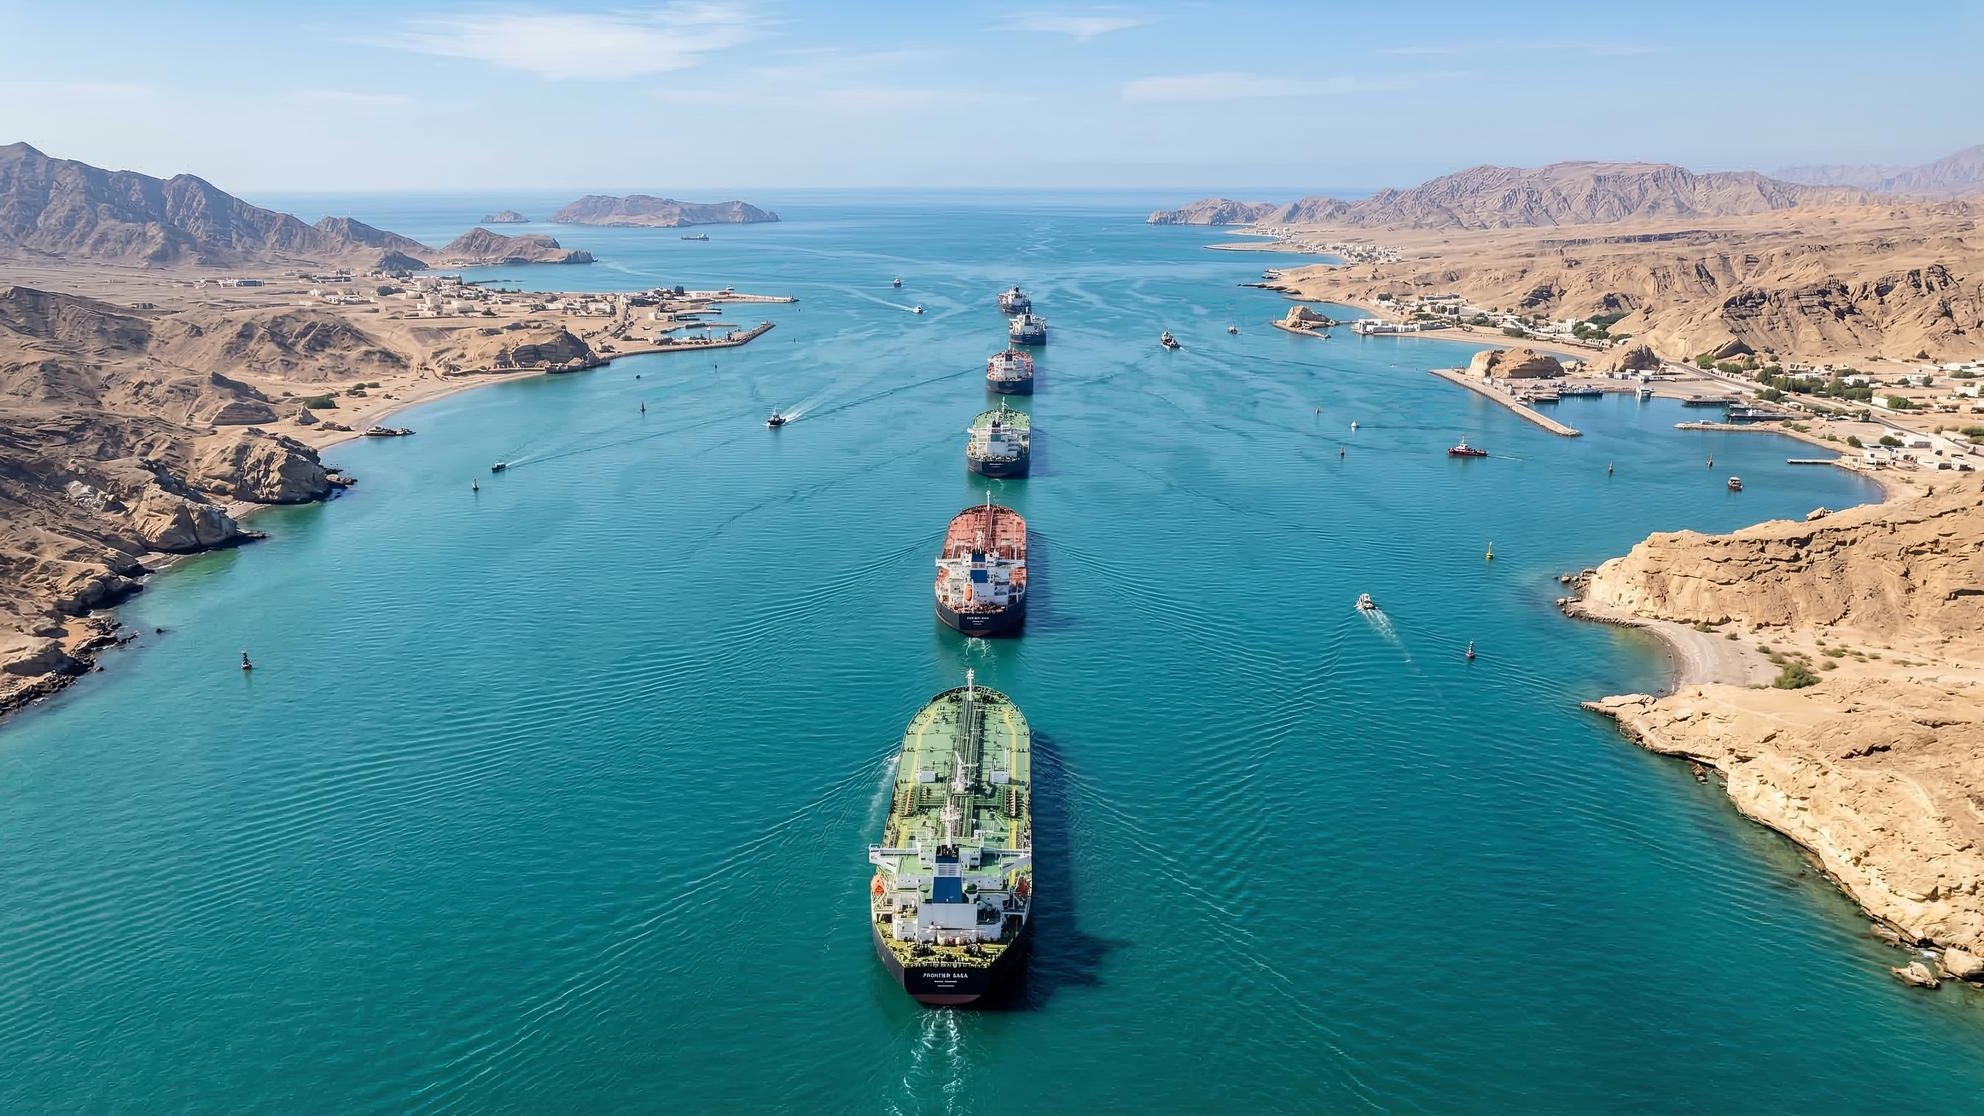
Only seven ships crossed the Strait of Hormuz on Friday, a fraction of the roughly 100 vessels that pass through on a typical day. The world’s single most important oil transit corridor has now been effectively shut down for 94 days, squeezing global crude supply lines and forcing tanker operators into longer, costlier alternatives. For energy importers across Asia and Europe, each additional day of near-total closure raises the cost of every barrel that must now travel around the southern tip of Africa or through other secondary routes.
What is verified so far
The Strait of Hormuz sits between Iran and Oman, connecting the Persian Gulf to the Gulf of Oman and the open ocean beyond. At its narrowest point, the waterway spans roughly 21 miles, with shipping lanes that compress commercial traffic into a corridor only a few miles wide. The U.S. energy agency has long classified it as the world’s most important oil chokepoint, a designation based on the sheer volume of petroleum that flows through it relative to any other maritime passage.
The agency’s baseline analysis draws on commercial tanker tracking data to measure transit volumes, and its published chokepoint framework positions Hormuz at the top of a hierarchy that includes the Strait of Malacca, the Suez Canal, and the Bab el-Mandeb strait. That ranking reflects the concentration of Saudi, Iraqi, Kuwaiti, and Emirati crude exports that depend on the passage. When the strait operates normally, the flow of oil through it represents a substantial share of global petroleum liquids trade, making any disruption felt almost immediately in spot markets and refinery scheduling worldwide.
Historical records assembled by the agency show that even short interruptions at Hormuz have triggered rapid price spikes. Insurance premiums for tankers rise, delivery windows stretch, and refiners in South Korea, Japan, India, and China face the prospect of drawing down strategic reserves or bidding up cargoes from Atlantic Basin producers. The current 94-day stretch of near-paralysis, if confirmed, would dwarf prior disruptions in modern records, though independent verification of the exact daily ship count and the precise start date of the closure relies on secondary reporting rather than primary government data.
Methodologically, the agency’s work is grounded in satellite-based vessel tracking, customs declarations, and export statistics. Its reliance on commercial traffic feeds allows analysts to reconstruct how much crude, condensate, and refined product move through narrow waterways over time. Those long-run datasets underpin the widely cited conclusion that Hormuz is the single most critical maritime artery for oil, and they provide a robust baseline against which any current disruption can be assessed.
What remains uncertain
The specific figure of seven ships crossing on Friday and the 94-day timeline originate from secondary reporting rather than from the agency’s own datasets or official port authority disclosures. The published analyses cover historical transit volumes and the strategic importance of the strait, but they do not provide real-time daily vessel counts. Commercial vessel tracking services, such as those referenced in the agency’s methodology, could in principle confirm or challenge the seven-ship figure, but no primary dataset in the available reporting block supplies that exact number with full provenance.
The cause of the prolonged disruption also lacks a single authoritative account. Regional conflict is broadly cited, but the specific military, diplomatic, or operational triggers that reduced traffic from roughly 100 ships per day to single digits have not been documented in the primary sources reviewed here. Whether the reduction reflects a formal blockade, heightened insurance costs that discourage transit, active military interdiction, or some combination of these factors is not settled by the available evidence. Without clear statements from coastal states, naval coalitions, or major shipping insurers, the mechanism behind the slowdown remains a matter of inference.
Equally unclear is how much crude has been rerouted versus how much demand has simply gone unmet. Alternative routes exist, primarily the long haul around the Cape of Good Hope, but the capacity of the global tanker fleet to absorb that additional distance at scale has not been quantified in the primary material available for this analysis. Some portion of the shortfall may be offset by pipeline systems that bypass the strait entirely, including routes that move Gulf crude overland to the Red Sea or the Mediterranean. However, the extent of that relief, and whether those lines are operating at or near capacity, is not confirmed in the reviewed documentation.
Downstream effects are similarly difficult to pin down with precision. Spot prices for benchmark crudes have risen, but disentangling how much of that move reflects actual lost barrels versus anticipatory buying is inherently challenging. Refiners may be drawing on inventories, delaying maintenance, or adjusting product slates to cope with tighter supplies, yet those operational choices are typically disclosed only in aggregate or with a lag. In the absence of transparent, real-time reporting, analysts are left to infer the scale of the disruption from price behavior, shipping patterns, and anecdotal accounts from traders and shipowners.
How to read the evidence
The strongest evidence in this story comes from the agency’s own classification of Hormuz as the top global oil chokepoint and from its use of commercial tanker tracking data to build volume estimates. These are institutional sources with transparent methodology, and they establish the baseline against which the current disruption should be measured. When analysts state that Hormuz handles a dominant share of seaborne oil trade, that claim rests on years of satellite-derived vessel data cross-referenced with customs and export records rather than on short-term market commentary.
The daily ship count and the 94-day duration, by contrast, sit on weaker evidentiary footing. They appear in secondary reporting and have not been matched to a named dataset or official government statement in the materials available. That does not mean the figures are wrong, but readers should treat them as estimates rather than confirmed statistics until a primary source publishes corroborating data. The gap between what has been documented historically and what is happening operationally right now is the central tension in evaluating this story.
Sentiment-level evidence, such as market chatter about panic or statements from unnamed traders, carries the least weight. Oil prices respond to real supply constraints, but they also respond to fear, rumor, and speculative positioning. Distinguishing between a price move driven by actual barrels lost and one driven by hedging behavior requires more than a glance at intraday charts. It demands cross-checking price action against observable changes in shipping flows, refinery runs, and inventory levels, all of which are captured imperfectly and with delays.
For readers trying to make sense of the situation, a tiered approach to evidence can help. At the top sit long-standing, methodologically transparent datasets that define the structural importance of the Strait of Hormuz. In the middle are contemporary but not fully sourced claims about current traffic levels and rerouting patterns, which should be treated as provisional. At the bottom are anecdotal reports and emotionally charged commentary, which may color perceptions but rarely settle factual questions.
Until real-time, primary data on vessel movements and export volumes are released, the most defensible conclusion is that an unusually severe disruption is under way at the world’s key oil chokepoint, with significant but not yet fully quantifiable consequences for global energy markets. The precise scale, duration, and causes of that disruption remain uncertain, and any firm numerical claims about ship counts or lost barrels should be read with that caveat firmly in mind.