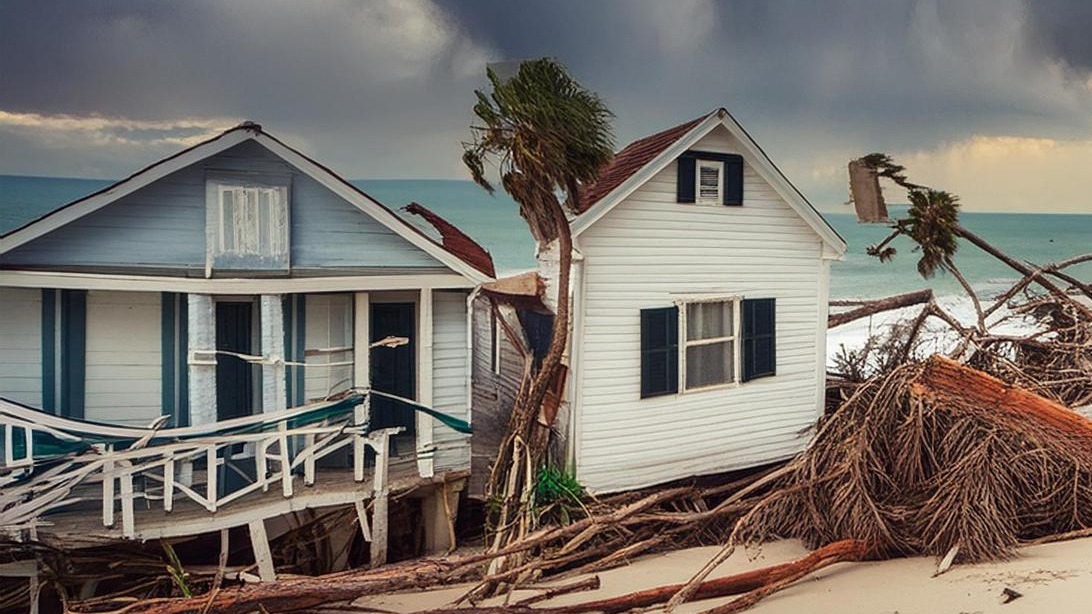
Homeowners filing claims with the largest property insurers in the United States now face odds that look more like a coin toss than a safety net. An analysis of insurer data found that State Farm, Allstate, Liberty Mutual, USAA, and Farmers did not pay out on more than 44% of claims they resolved in 2025. That nonpayment rate climbed from 36% a decade earlier, meaning the gap between paying premiums and collecting on a loss has widened sharply for millions of policyholders.
Rising denial rates hit hardest after storm seasons
The jump from 36% to 44% over roughly ten years did not happen in a vacuum. Catastrophe-prone states have generated surging claim volumes, and the friction between insurers and policyholders has grown alongside them. Florida’s Office of Insurance Regulation publishes catastrophe reporting tables that track claims closed without payment for specific reasons, including duplicate filings, claims opened in error, and cases where the insured failed to communicate or cooperate. Those categories may sound technical, but each one represents a homeowner who reported damage and ultimately received nothing.
The pattern raises a direct question for homeowners in high-risk ZIP codes: are denial rates climbing fastest where storm-driven claim volume has doubled since 2020? Matching county-level closed-without-payment counts from Florida’s regulator to market-share filings could test that theory, but no public dataset currently links the five named carriers’ individual denial rates to specific geographies in a machine-readable way. The data exists in pieces across state agencies, yet no regulator has assembled it into a single, carrier-specific breakdown. For now, homeowners can see broad trends but cannot easily tell how their own insurer compares with its peers in a given coastal county.
That gap in visibility matters most in the years after major hurricanes, when insurers and policyholders are both under strain. Companies face thousands of claims at once, while families confront roof damage, mold, and temporary displacement. In that environment, the reasons a claim ends up closed without payment can blur together: documentation gaps, missed deadlines, or disputes over whether the damage stems from wind, flood, or pre-existing wear and tear. Each factor can tip a borderline claim into the “no payout” column.
What the five carriers’ nonpayment numbers actually show
The analysis covering the five biggest home insurers drew on resolved claims data to calculate the share that ended with zero dollars paid to the policyholder. State Farm, Allstate, Liberty Mutual, USAA, and Farmers together dominate the U.S. homeowners market, so their collective behavior sets the baseline experience for a large share of American households. When nearly half of all resolved claims produce no payout, the practical value of a policy shifts: homeowners still pay rising premiums but face increasing uncertainty about whether a covered event will actually result in compensation.
Insurers emphasize that not every reported loss qualifies under a policy. Some claims turn out to be below the deductible; others involve excluded perils, such as flooding under a standard homeowners contract. In addition, some policyholders withdraw or abandon claims once repairs are completed out of pocket or after realizing that filing could raise future premiums. These explanations account for part of the nonpayment rate, but the steady climb from 36% to 44% suggests structural changes in underwriting, policy design, or claims handling that go beyond routine housekeeping.
One factor is the spread of higher deductibles and special hurricane or wind deductibles in coastal states. As deductibles rise, more moderate losses fall below the threshold, inflating the share of claims closed without any money changing hands. Another is the growing use of detailed policy exclusions and sublimits that carve out specific types of damage, from cosmetic roof issues to certain water leaks, leaving homeowners surprised when what they thought was covered is not.
Regulators track denials, but consumers see little detail
State regulators collect standardized denial metrics through the Market Conduct Annual Statement process, which the National Association of Insurance Commissioners administers and individual states enforce. Washington state, for example, requires insurers to file MCAS data under a specific insurance statute, giving regulators a consistent framework for tracking how companies handle claims. Those filings can reveal patterns in how often carriers deny claims, how quickly they respond, and whether particular lines of business show outlier behavior.
Florida’s CFO office maintains a separate company lookup tool that lets consumers review basic information about insurers operating in the state, including licenses, complaints, and regulatory actions. While useful for checking whether a company is authorized and whether it has drawn scrutiny from regulators, the database does not directly map to the claim-level statistics used in broader denial-rate analyses. A homeowner can see that an insurer has been the subject of complaints, but not how often that insurer closes claims without payment compared with its competitors.
Nationally, the most detailed nonpayment figures for the largest carriers come from investigative work such as the Wall Street Journal analysis, which aggregated internal reporting from State Farm, Allstate, Liberty Mutual, USAA, and Farmers. That reporting filled a gap left by public regulators: it translated raw claim counts into an accessible metric-the share of resolved claims that end in zero payout-across the dominant players in the market. Yet the underlying data is still not available in a form that allows homeowners to compare denial rates by state, peril, or policy type.
What homeowners can do in a coin-flip environment
For now, consumers have to navigate this landscape with imperfect tools. Experts recommend reading policy declarations closely, paying particular attention to deductibles, exclusions, and special hurricane or wind provisions. After a loss, documenting damage thoroughly with photos, contractor estimates, and contemporaneous notes can reduce the risk that a claim is denied for lack of evidence or clarity. Shopping among multiple insurers, even within the same state, may also uncover differences in coverage terms that matter more than headline premium comparisons.
As climate-driven catastrophes grow more frequent and costly, the tension between affordability and reliability in home insurance will only intensify. Rising nonpayment rates among the biggest carriers signal that the traditional promise of homeowners coverage-pay premiums now, receive help when disaster strikes-is under pressure. Until regulators or lawmakers require more granular public reporting on claim outcomes, homeowners will continue to make one of their largest financial decisions with only a partial view of how often the safety net actually holds.
Free for readers: The free Retirement Shield newsletter sends plain-English help keeping more of your money in retirement — the scams to dodge, the benefits you’re owed, and what’s changing with Social Security and Medicare, a couple times a week. Get the free newsletter.