The national average price for a gallon of regular unleaded gasoline climbed to $4.20 for the week ending April 28, 2026, according to the U.S. Energy Information Administration’s weekly retail price tracker. That is the highest pump price American drivers have faced since the week ending June 13, 2022, when post-pandemic demand and the fallout from Russia’s invasion of Ukraine pushed the average to a record $5.01.
For a household filling a standard 15-gallon tank once a week, the jump from the sub-$3.50 averages that held through much of 2023 and 2024 adds roughly $10 or more per fill-up. Multiply that across millions of commuters, delivery drivers, and families heading into the peak spring travel season, and the cumulative drag on consumer spending is significant.
AAA has warned that rising fuel costs compound the pressure households already feel from elevated grocery prices and higher insurance premiums. “Every penny increase in gasoline prices takes roughly $1.4 billion out of consumers’ pockets on an annualized basis,” the organization noted in its fuel price briefing.
How $4.20 stacks up historically
In raw dollar terms, $4.20 per gallon ranks among the steepest readings in the EIA’s dataset, which stretches back to 1991. But the agency’s gasoline price explainer draws a useful distinction between nominal prices and inflation-adjusted ones. When you account for the eroded purchasing power of the dollar, today’s price still falls below the peaks reached in the summer of 2008, when crude oil briefly topped $147 a barrel and the real cost per gallon was considerably higher.
That distinction does not make the current spike painless. Wages have grown unevenly since 2022, and households are simultaneously absorbing higher costs for housing, food, and auto insurance. A gallon of gas is one of the most visible prices in the economy, posted on signs that drivers pass every day, and its psychological weight often exceeds its actual share of the monthly budget.
The more relevant comparison for most consumers is recent memory. Through much of 2024, the national average hovered in the mid-$3 range. The climb toward $4.20 represents a roughly 20 percent increase from those levels, a pace that has outstripped general inflation over the same period.
What is driving the increase
No single factor explains the entire move, but several forces are converging at once.
Crude oil, which typically accounts for more than half the retail price of gasoline, has firmed in 2026 amid tighter-than-expected global supply. OPEC+ production decisions continue to constrain output, and geopolitical uncertainty in key producing regions has kept a risk premium embedded in futures prices. On the demand side, the U.S. driving season ramp-up, which traditionally begins around Easter and accelerates through Memorial Day, is pulling more gasoline off the market just as refineries complete their spring maintenance turnarounds.
Refining margins have also widened. Scheduled and unscheduled maintenance at several Gulf Coast and Midwest facilities tightened the supply of finished gasoline heading into April, pushing wholesale prices higher before the increase reached retail pumps. OPIS, the Dow Jones-owned fuel pricing service, reported that wholesale gasoline margins in late April were running well above their five-year seasonal average.
Trade policy is adding another layer of uncertainty. Tariffs on imported crude oil and refined petroleum products, expanded under the current administration’s broader trade agenda, have raised costs for some refiners who depend on foreign feedstocks. While the United States is a net petroleum exporter, specific refineries along the Gulf Coast and East Coast process significant volumes of imported heavy crude, and higher input costs can ripple through to the pump.
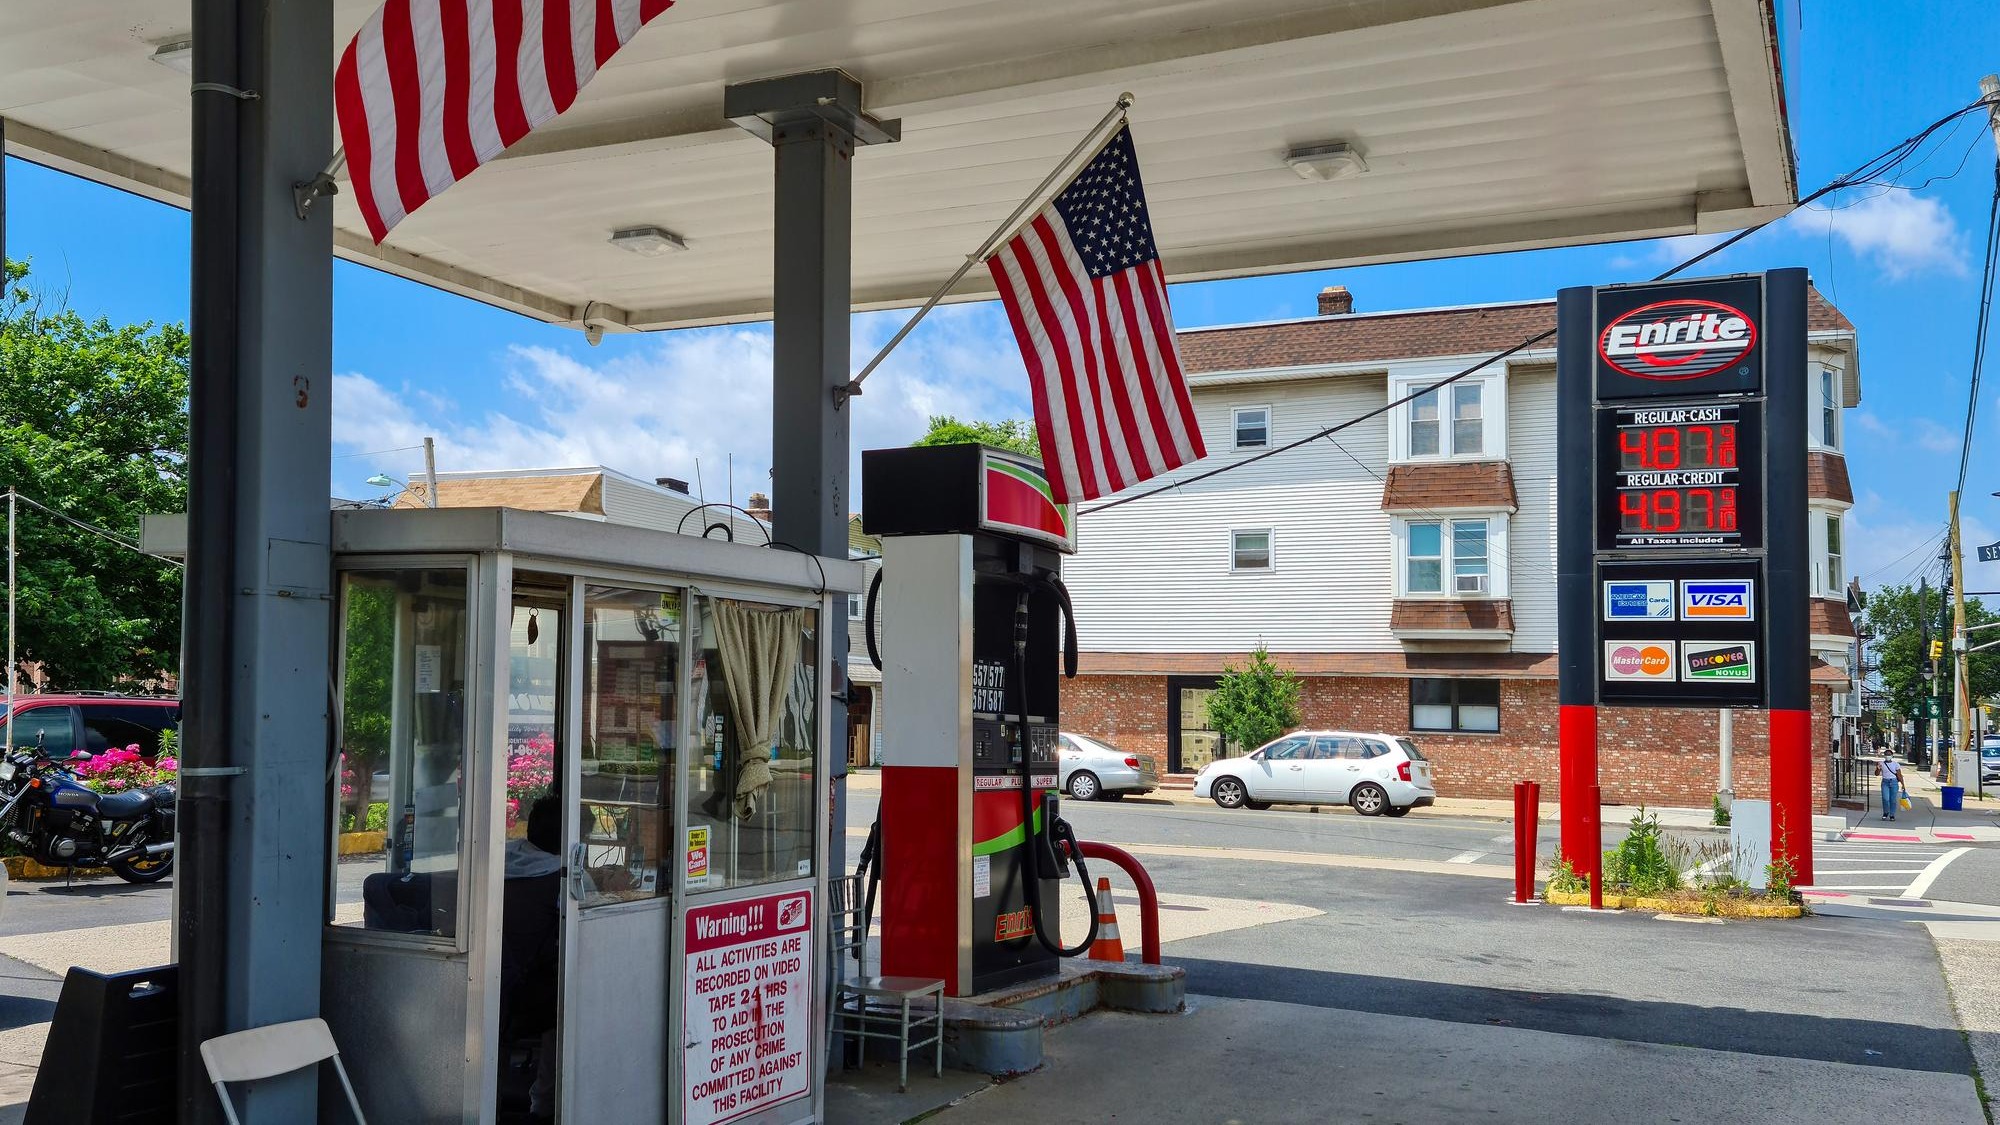
State and federal taxes, which vary widely, compound the picture further. California drivers routinely pay $1.00 or more per gallon above the national average due to the state’s fuel taxes and cap-and-trade program.
The regional picture
The $4.20 figure is a nationwide average, and it masks wide variation from state to state. The West Coast consistently pays the most, driven by California’s regulatory costs and the region’s relative isolation from Gulf Coast refining capacity. Gulf Coast states like Texas, Louisiana, and Mississippi tend to pay the least, benefiting from proximity to refineries and lower state fuel taxes. The Midwest and East Coast typically fall somewhere in between, though local disruptions, such as a pipeline outage or a refinery fire, can cause temporary spikes in any region.
The EIA breaks its data down by Petroleum Administration for Defense Districts, and those regional snapshots often reveal how much a national “average” can obscure. A commuter in Los Angeles filling up at $5.50 and a driver in Houston paying $3.70 are both living under the same $4.20 headline, but their household budgets tell very different stories.
Where prices may head next
The EIA’s Short-Term Energy Outlook, most recently updated in April 2026, projects retail gasoline prices for the months ahead based on modeled assumptions about global crude supply, refinery utilization, and consumer demand. Like any forecast, it carries uncertainty. An unplanned refinery outage, a major hurricane in the Gulf of Mexico, or a shift in OPEC+ policy could push prices sharply in either direction.
Seasonal patterns offer some guidance. Gasoline prices in the United States typically peak between late May and early July, when summer driving demand is highest and refineries have fully switched to more expensive summer-blend fuel. If the current trajectory holds, drivers could see prices climb further before any relief arrives in the fall.
A meaningful increase in global crude production, whether from OPEC+ easing its cuts or from rising U.S. shale output, could soften prices faster than the seasonal pattern would suggest. The market is finely balanced, and relatively small shifts in supply or demand can move the national average by 20 to 30 cents per gallon within a matter of weeks.
How drivers are stretching their fuel budgets
For most Americans, gasoline is a non-negotiable expense. But the size of the bill is not entirely fixed. Apps like GasBuddy and the AAA fuel price finder allow drivers to compare prices station by station, and the spread between the cheapest and most expensive stations in a single metro area can easily reach 40 to 50 cents per gallon. Paying with cash at stations that offer a cash discount, consolidating errands to reduce total miles driven, and keeping tires properly inflated for better fuel economy are small moves that add up over a full tank and a full year.
For policymakers and economists, the deeper question is whether sustained fuel costs above $4.00 will begin to weigh on consumer confidence and spending in other categories. Gasoline is not the largest line item in most household budgets, but it is the most frequent and most visible one. If prices remain elevated through the summer of 2026, the effects will reach well beyond the gas station, showing up in everything from restaurant receipts to retail sales reports.


