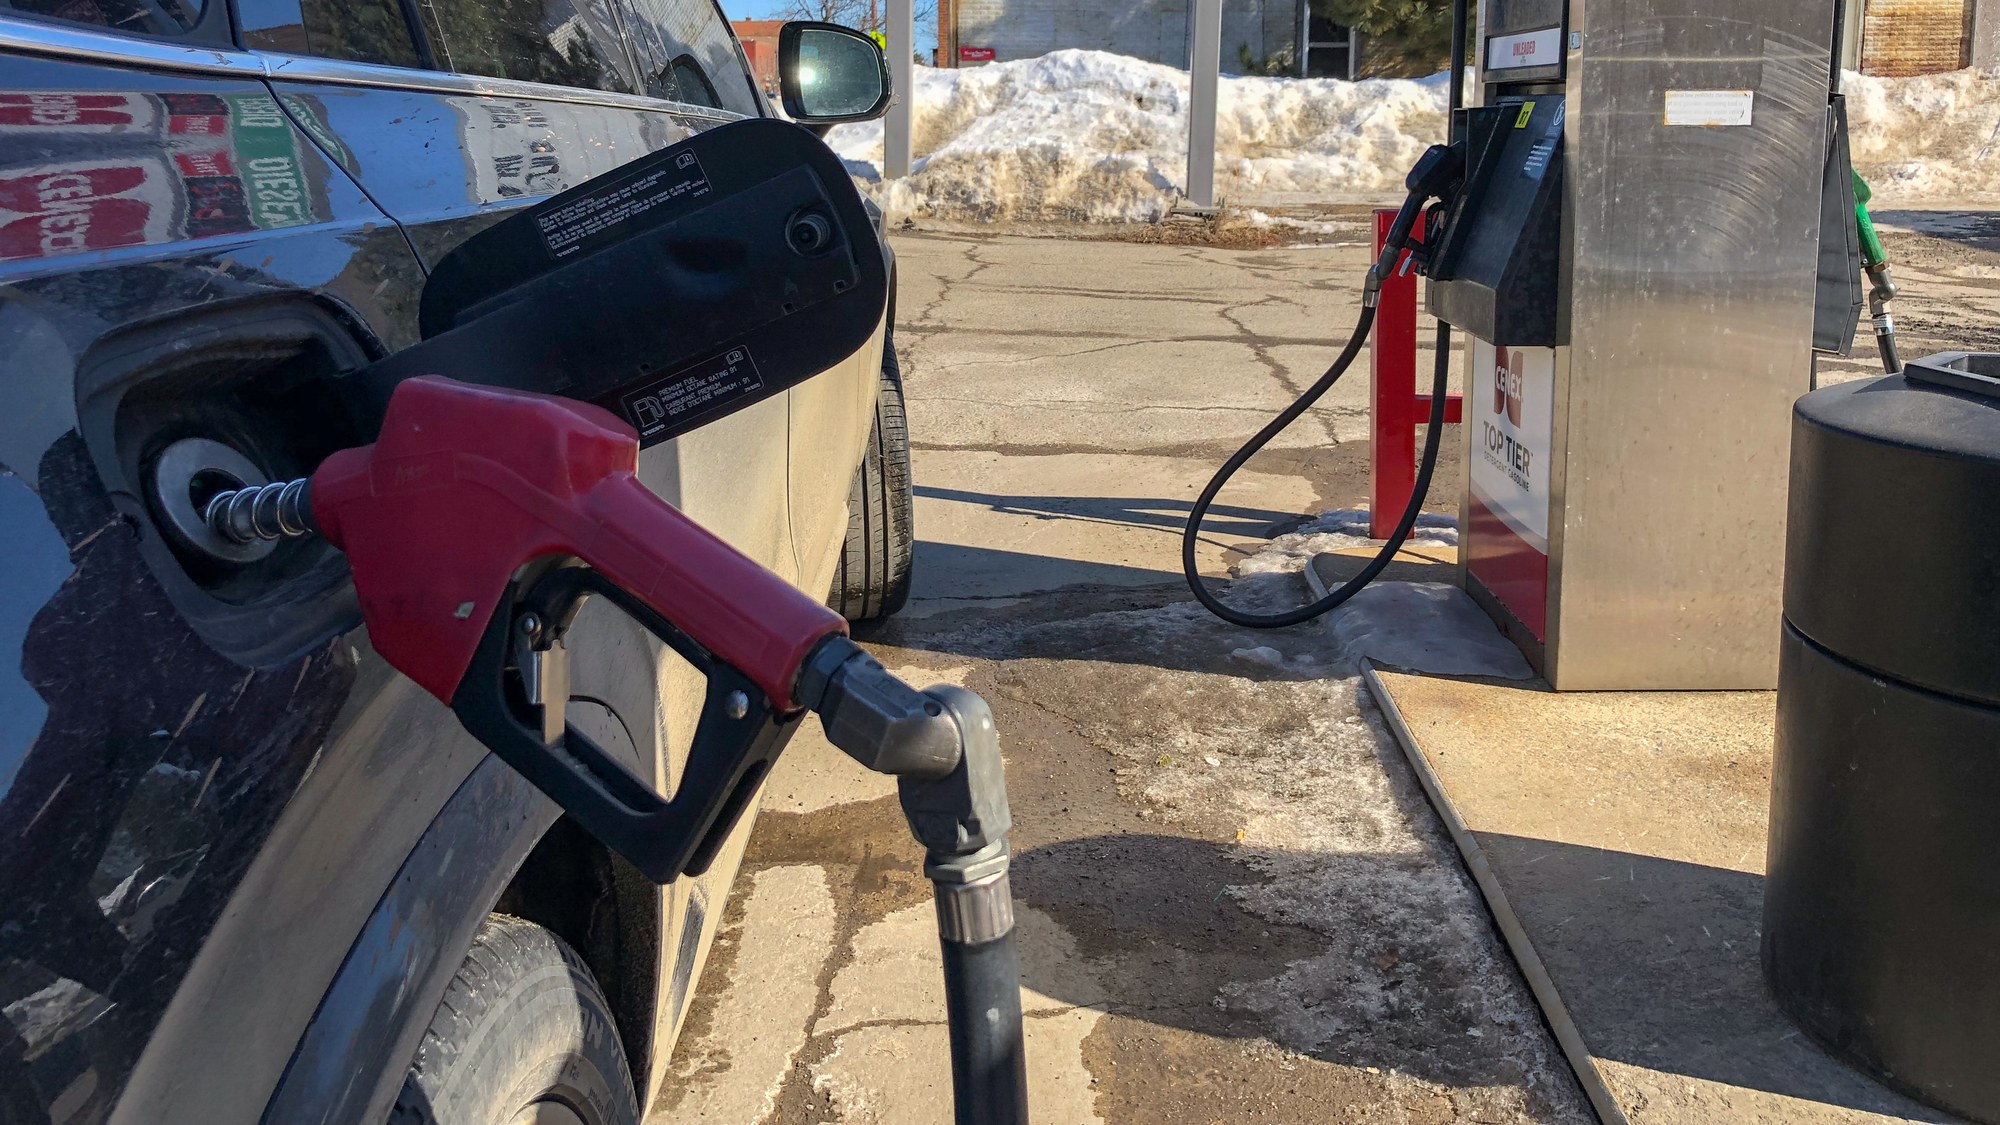
Regular gasoline averaged $4.4918 a gallon nationwide on September 25, according to AAA’s daily fuel-price survey — a figure that rounds to $4.49 and sits $1.3339, or roughly $1.33, above the $3.1579 a gallon AAA recorded a year earlier. The increase has been fast as well as large: AAA’s own tracking put the national average at just $4.0969 a month before, on August 25. Diesel, which fuels the trucks that stock grocery shelves, is running even higher, at $6.4839 a gallon as of September 26.
Costs a pump price can’t offset: The Senior Property Tax & Home-Cost Relief Kit covers the 5 kinds of property-tax relief and heating-and-cooling help homeowners often never apply for. See the heating and cooling help inside the kit →
AAA’s Daily Survey Shows A Fast Climb, Not A One-Day Spike
AAA updates its national average gas price daily, and the trend behind the $4.49 figure is not a single-day event. The average rose from $4.0969 a month earlier to $4.4918 on September 25, a roughly 39-cent increase in thirty days on top of the $1.3339 climb over the full year, according to AAA’s fuel-price survey. A day later, on September 26, AAA’s tracker put the average at $4.4874, still up from $4.4759 the week before that, showing the price holding near its recent high and continuing to inch upward rather than reversing. The federal government’s own weekly survey shows the same climb independently of AAA: the U.S. Energy Information Administration’s retail gasoline report put the national average at $4.478 a gallon for the week ending September 21, up 15.9 cents from the week before and $1.305 from a year earlier — a slightly different weekly figure than AAA’s daily number, produced by a different survey methodology, but pointing to the same direction and roughly the same size of increase.
That pattern of small, steady weekly increases rather than one sharp jump is part of why the year-over-year comparison in the $1.33 figure matters more than any single day’s move. A price that spikes and falls back can be a temporary supply disruption; a price that has climbed in overlapping monthly and weekly windows, as AAA’s own numbers show here, points to a cost that is not expected to retreat on its own in the near term.
Diesel Is Climbing Even Faster, With Consequences Beyond The Pump
The national average diesel price reached $6.4839 a gallon on September 26, according to AAA, a gap of roughly two dollars over regular gasoline; the EIA’s own weekly diesel figure, $6.529 a gallon for the week ending September 21, up $2.78 from a year earlier, points to the same widening gap. Diesel matters to more than truckers filling up: the same fuel powers the freight trucks that carry groceries, medical supplies and heating oil to retailers, so a sustained diesel increase tends to reach the price of goods on a store shelf weeks after it first shows up at a truck stop. AAA’s survey does not break down how much of a retailer’s shelf price reflects fuel surcharges versus other costs, but the size of the current gap between diesel and regular gasoline means freight costs are rising faster than what a driver feels directly at the pump.
The National Number Hides A Wide Range, Even Within One Region
AAA’s national figure blends prices that vary sharply by state, and the spread shows up even among neighbors. Hawaii’s average stood at $5.5862 a gallon, more than a dollar above the national figure, while Delaware’s was $4.3533, the lowest among the states AAA’s page lists. Nearby New England and Mid-Atlantic states cluster closer to Delaware than to the national average: Connecticut at $4.5020, Massachusetts at $4.3964, New Jersey at $4.3838, Rhode Island at $4.3853, Vermont at $4.4532, Maryland at $4.3739, New Hampshire at $4.3717 and the District of Columbia at $4.4882, all per AAA’s same survey. A retiree budgeting off the nightly headline number could be paying considerably more or less than $4.49 depending on where they live, which is part of why AAA reports state-level figures alongside its national average rather than a single blended price.
What An Extra $1.33 A Gallon Adds Up To Over A Month
Applied to routine driving, the $1.3339 year-over-year increase AAA’s survey shows is not a rounding error. A driver filling a 15-gallon tank once a week is paying roughly $20 more per fill-up than a year ago at the current national average, which works out to something in the neighborhood of $85 to $90 over a full month of weekly fill-ups, a figure derived directly from AAA’s own reported price difference, not a separate estimate from another source. For a retiree who drives primarily for groceries, prescriptions and medical appointments rather than a commute, that added cost lands on a budget with no matching increase in income to absorb it.
Why The Increase Lands Differently On A Fixed Income
A dollar-plus increase at the pump affects every driver, but not every driver’s budget absorbs it the same way. A worker with a flexible paycheck can offset a fuel increase by picking up extra hours or delaying a discretionary purchase; a retiree living on a fixed monthly Social Security or pension payment has no comparable lever, since that payment does not move to match a single expense category’s mid-year jump. The gap between Hawaii’s $5.5862 average and the sub-$4.40 prices clustered across Delaware, New Jersey, Massachusetts and Rhode Island also means the size of that squeeze depends heavily on where a retiree lives and how far routine errands and medical appointments require driving, a variable AAA’s survey captures precisely even when a single national number does not.
None of AAA’s figures point to an imminent reversal. The national average has moved in the same direction across every time window the survey tracks, day-over-day, week-over-week and year-over-year, which means a household that adjusted its driving or its budget expecting prices to settle back down after a temporary spike has instead been absorbing a cost that has kept climbing through late September.
The Utility Squeeze A Pump Price Doesn’t Explain
AAA’s own daily survey shows gasoline costing meaningfully more than it did a year ago, with prices holding near their recent high rather than reversing, but a pump price only ever describes one line on a household budget. It says nothing about a property tax bill, a heating bill or a cooling bill rising on its own separate schedule while a fixed income absorbs all three at once.
The Senior Property Tax & Home-Cost Relief Kit opens with the circuit-breaker credit that includes renters and keeps an application log and renewal calendar for tracking filing windows on the costs gas prices never touch.
Check the renewal calendar in The Senior Property Tax & Home-Cost Relief Kit.
This article was produced with AI assistance and checked against the primary sources linked above.