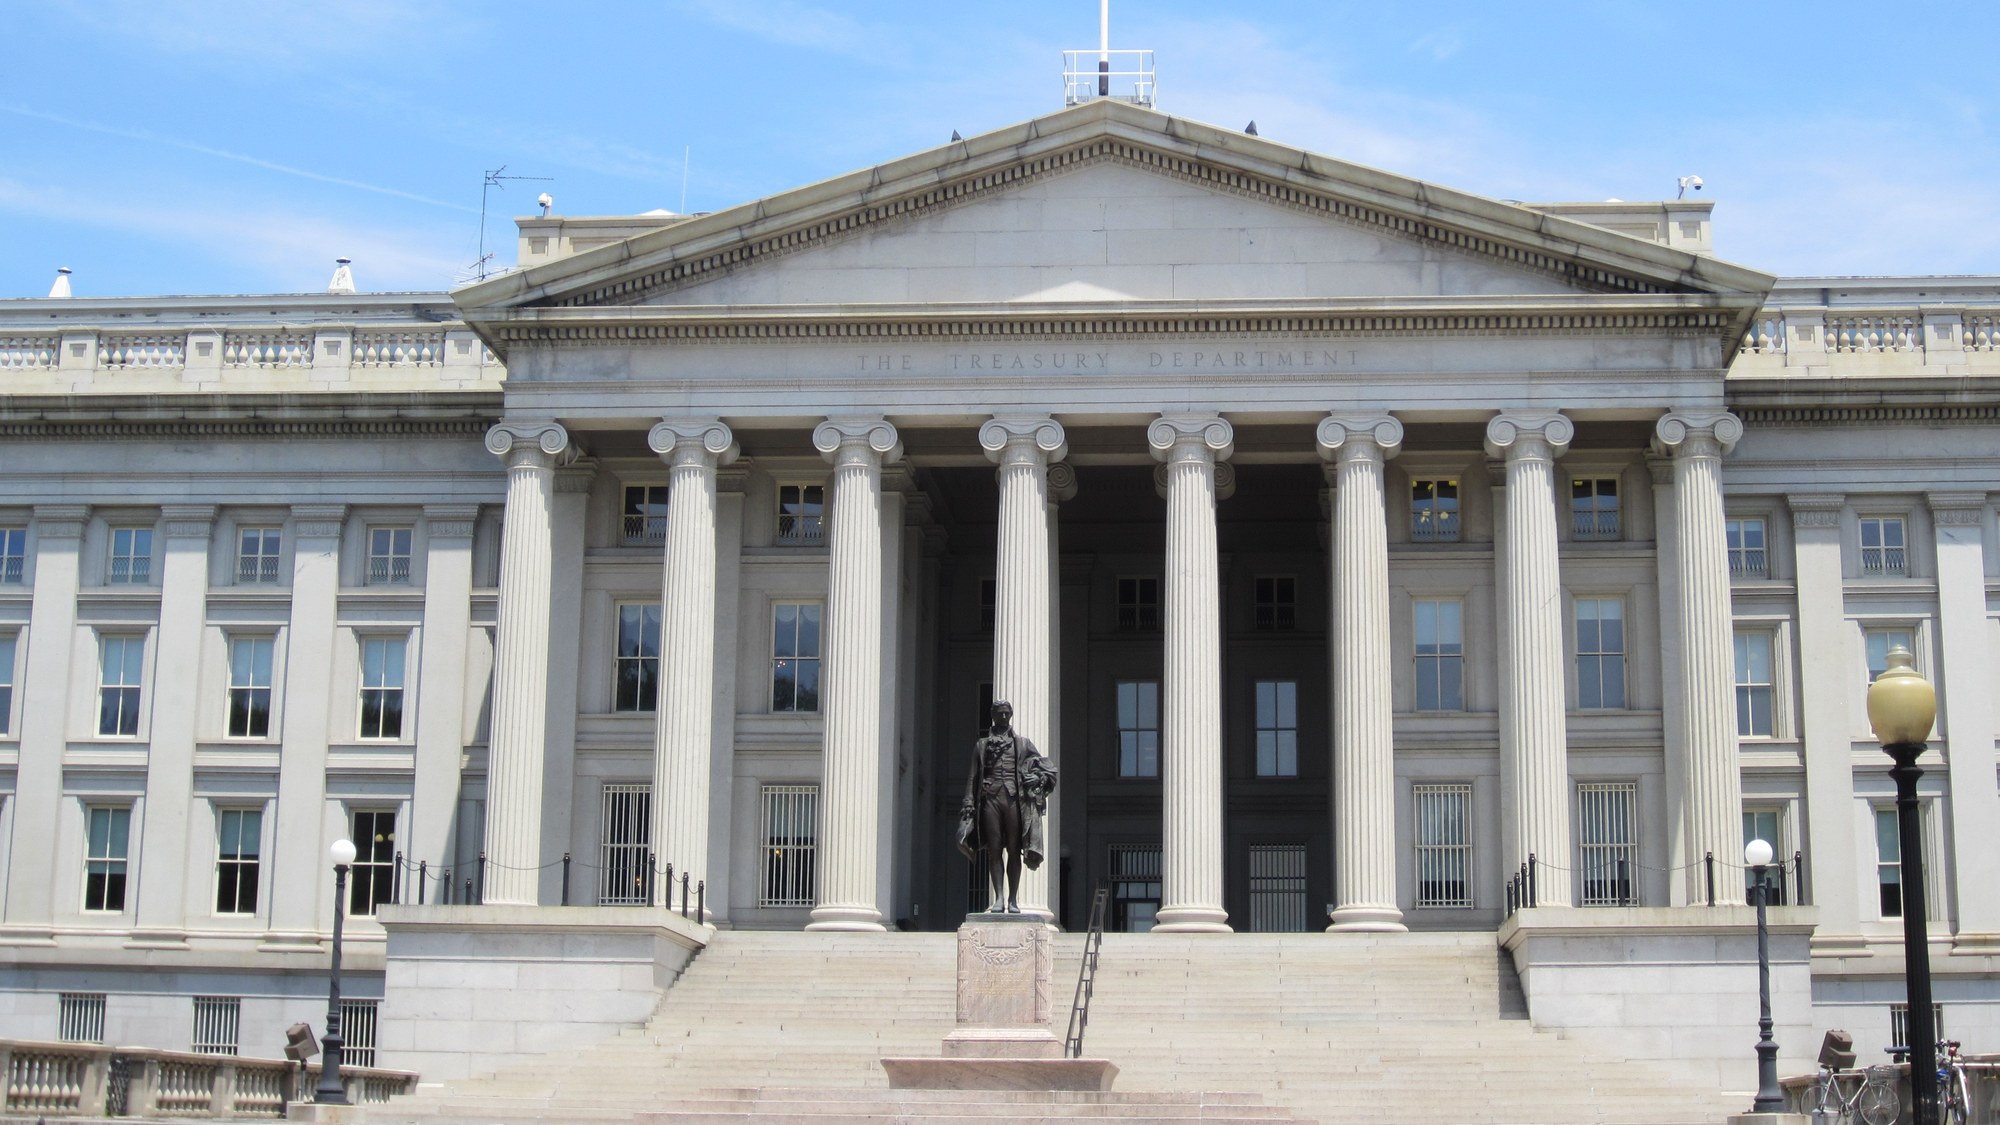
Net interest on the federal debt reached $1.052 trillion in the first 11 months of fiscal year 2026, up 12% from the same period a year earlier, the Congressional Budget Office said in its September 9 Monthly Budget Review. The $111 billion increase reflects a larger outstanding debt and higher long-term interest rates, partly offset by lower short-term rates, according to CBO. The overall federal deficit for the same 11 months totaled just under $2.0 trillion, the agency reported, a figure it says was little changed from a year earlier.
What the interest bill doesn’t touch: CBO’s $1.05 trillion figure is Washington’s borrowing cost, not the property-tax relief a retiree can file for locally, covered in The Senior Property Tax & Home-Cost Relief Kit. See the five relief options that don’t depend on Washington →
What CBO’s Ledger Shows For Interest Costs
The Congressional Budget Office’s Monthly Budget Review states that “outlays for net interest on the public debt rose by $111 billion (or 12 percent)” during October 2025 through August 2026, compared with the same 11 months of fiscal year 2025, bringing the total to $1.052 trillion from $941 billion a year earlier. CBO attributes the increase to two forces moving at once: the amount of outstanding federal debt was larger than in the prior year, and long-term interest rates were higher, a combination only partly offset by declining short-term rates, the report states. CBO does not publish a specific rate figure or dollar debt total behind those two drivers in the same passage, describing their direction rather than their exact size. The federal government finances much of its debt with securities that mature and are replaced, or “rolled over,” on a regular cycle, so even without any new borrowing, a Treasury bill or note issued years ago at a lower rate is eventually replaced by a new one priced at whatever rate the market demands today. CBO’s report frames the $111 billion increase as the product of a larger debt base and higher long-term rates partially offset by lower short-term rates, without stating how much of the increase came from each cause individually. The debt base itself is large and growing: total public debt outstanding stood at just over $40.07 trillion as of September 24, 2026, according to the Treasury Department’s Debt to the Penny dataset, the daily figure CBO’s own interest-cost estimate rests on top of.
Interest Now Rivals The Government’s Biggest Programs
At $1.052 trillion for the 11-month period, net interest on the debt has grown large enough to sit ahead of several of the federal government’s largest spending categories, based on the same CBO report. Medicaid spending, net of offsetting receipts, totaled $655 billion over the same 11 months, up 8%; Veterans Affairs spending totaled $394 billion, up 14%; and defense spending totaled $833 billion, up 5%, CBO reported. Only Social Security, at $1.514 trillion, and Medicare, at $976 billion net of offsets, still outran the interest bill in dollar terms, and Medicare’s total sat only $76 billion above it. CBO’s own release places net interest inside the same three-line comparison it uses for the government’s largest mandatory programs, which is a deliberate choice by the agency to show the bill’s scale rather than an inference added elsewhere. That comparison is a snapshot of 11 months only, not a full fiscal year, and CBO does not restate it in an annualized form anywhere in the same report.
The Deficit Story Behind The Interest Number
The federal deficit for the first 11 months of fiscal year 2026 totaled $1.967 trillion, versus $1.973 trillion for the same period a year earlier, a decline of about $6 billion that CBO frames as essentially flat once accounting for calendar shifts. Federal receipts rose 3% to $4.845 trillion and outlays rose 2% to $6.812 trillion, or 4% after adjusting for the timing of certain payments that fell in different months than usual, according to the same Monthly Budget Review. Both fiscal years’ deficit totals in that comparison already reflect actual, not projected, revenue and spending recorded through August, which is why CBO characterizes the year-over-year change as a recorded decline rather than an estimate that could still move before the fiscal year closes. Interest costs rising 12% while overall outlays rose only 2% to 4% means the interest line grew several times faster than federal spending as a whole over the same 11 months, by CBO’s own figures. That comparison is itself limited to the period CBO has already recorded; the agency does not use this particular report to say what September, the fiscal year’s final month, will add to either total.
Who’s Behind The Numbers
The Monthly Budget Review is a standing CBO publication issued under Director Phillip L. Swagel, with this edition credited to CBO analysts Justin Latus and Jennifer Shand, assisted by Aaron Feinstein, according to the report’s own credits page. CBO is a nonpartisan legislative-branch agency, and the Monthly Budget Review is one of its recurring public releases rather than a one-time or election-driven report. CBO compiles the estimate from Treasury’s daily reporting of federal receipts and outlays rather than from a survey or a projection model, which is why the agency presents these as actual results for the 11 months already completed rather than a forecast for the rest of the fiscal year.
What The Rising Interest Bill Doesn’t Decide Locally
None of CBO’s figures determine what any single household pays in property tax, homeowners insurance or a utility bill, since those are set by state and local authorities working from entirely separate budgets than the one CBO is describing. A $111 billion jump in federal interest costs says something about the government’s own borrowing terms; it says nothing about whether a specific county has renewed its senior property-tax freeze for the coming year, or whether a utility’s relief program still has funds available this winter.
The Interest Bill Washington Pays While Local Relief Waits
CBO’s net-interest figure is a federal ledger entry, not a signal about any single household’s property-tax bill or utility costs, which are set independently by state and local authorities regardless of what Washington pays its own bondholders. Nothing in the Monthly Budget Review changes any state’s property-tax or utility relief programs, or the deadlines that already govern them.
The Senior Property Tax & Home-Cost Relief Kit lays out the 5 kinds of property-tax relief, the circuit-breaker credit that includes renters, and an application log and renewal calendar for tracking each filing deadline.
Open the application log built for tracking a property-tax filing deadline in The Senior Property Tax & Home-Cost Relief Kit.
This article was produced with AI assistance and checked against the primary sources linked above.