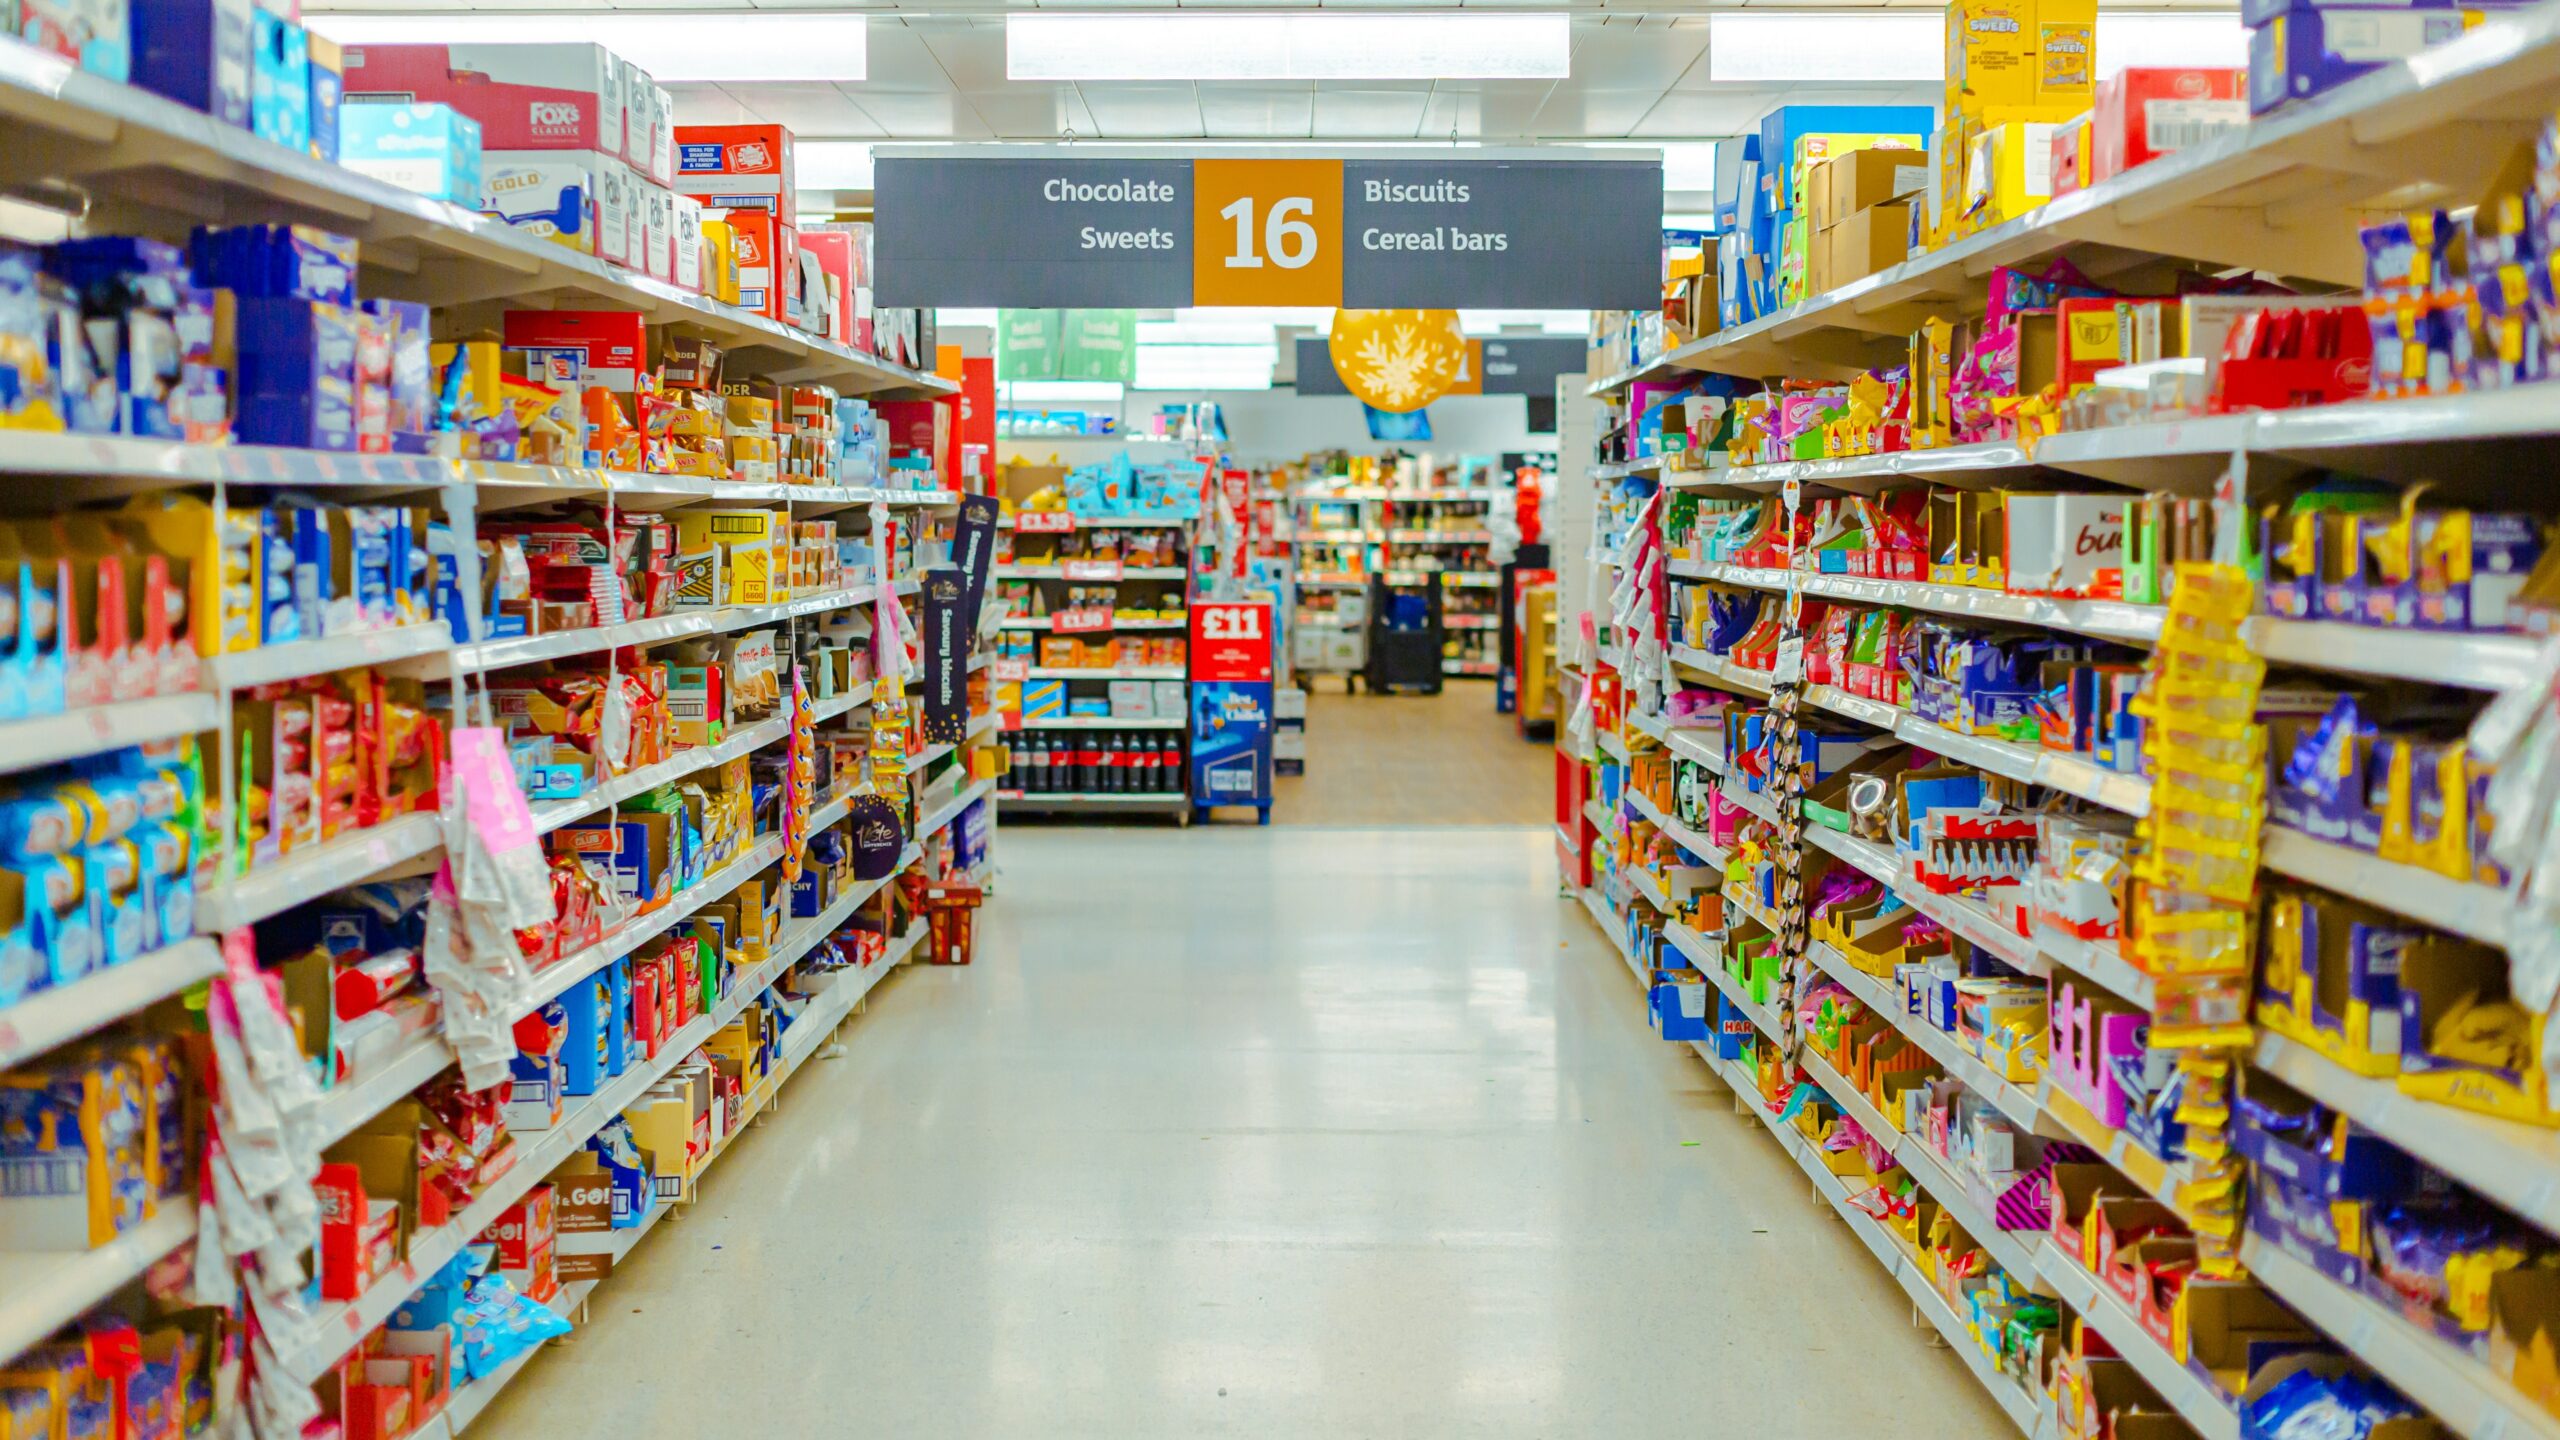
American households are paying roughly 25 percent more for groceries than they did in 2019, a cumulative price increase that continues to strain budgets even as the annual rate of increase has slowed closer to historical norms. The food-at-home component of the Consumer Price Index rose 2.7 percent in the twelve months ending June 2026, following a 2.3 percent increase for full-year 2025 and just 1.2 percent in 2024. Those single-year figures look modest compared with the spikes of 2021 and 2022, but they stack on top of years of sharp gains that have not reversed.
Why a 25 percent grocery price jump still squeezes shoppers
Cooling inflation is not the same as falling prices. The distinction matters for anyone scanning a receipt at checkout. Annual food-at-home price growth came in at 2.4 percent year-over-year in December 2025, according to the Bureau of Labor Statistics. That pace sat below the long-run average of 2.6 percent per year tracked by the USDA Economic Research Service. Yet the relief is relative: each new percentage point compounds on a base that already jumped sharply during the pandemic-era supply disruptions and input-cost surges of 2020 through 2023.
For a household that spent $5,000 a year on groceries in 2019, a 25 percent cumulative increase translates to roughly $1,250 more per year at the register. Wage growth has partially offset that burden for some workers, but grocery spending is not discretionary in the way a vacation or electronics purchase might be. Families with fixed incomes or those earning near the minimum wage absorb a larger share of that increase in their monthly budgets, leaving less room for savings or other expenses.
Those pressures show up in how people shop. Consumers report trading down within categories, shifting from fresh to frozen produce, buying more items on promotion, and favoring larger “value” sizes when they can afford the higher upfront cost. Store brands have gained share in many aisles as shoppers look for lower prices on staples like cereal, canned vegetables, and cleaning products. Even modest annual increases can feel relentless when rent, utilities, and transportation costs are also elevated, forcing difficult choices about nutrition and variety.
One question worth tracking is whether regions that experienced above-average cumulative grocery inflation since 2019 are also seeing faster consumer shifts toward store-brand packaged foods. National CPI data does not answer that directly, but the USDA maintains a Food-at-Home Monthly Area Prices dataset that enables localized comparisons across metro areas and food groupings. If 2026 retail scanner data eventually shows stronger private-label adoption in higher-inflation metros, it would confirm that sustained price pressure is reshaping purchasing habits at the local level, not just the national one.
Federal data behind the 25 percent cumulative increase
Two independent federal agencies anchor the claim. The Bureau of Labor Statistics publishes the Consumer Price Index, and its most recent release shows the food-at-home index reached 321.631 in June 2026, with a year-over-year gain of 2.7 percent. That index level, measured against a 1982–84 base of 100, captures decades of price movement, and the steepest climb within that series occurred between 2020 and 2023. Separately, the USDA Economic Research Service reported that food-at-home prices increased 1.2 percent in 2024 and 2.3 percent in 2025, both figures running below the historical average pace of 2.6 percent per year. The ERS uses BLS data as an input but applies its own ARIMA-based forecasting and categorization to summarize annual trends.
To understand how those annual changes add up to a roughly 25 percent jump since 2019, it helps to look directly at the CPI index levels. The BLS makes detailed CPI data tables available that show food-at-home values for each month. Comparing the index for late 2019 with the mid-2026 reading reveals that prices for groceries at home are about one-quarter higher overall, even after the most acute inflationary period has passed. Because the CPI is an index, not a dollar figure, this comparison is essentially measuring how much more a fixed basket of goods costs now than it did before the pandemic.
Researchers, journalists, and policymakers can replicate or refine these calculations using programmatic tools. The BLS supports automated access through its public API, documented in its developer guidance, allowing users to pull historical food-at-home series and compute cumulative inflation for specific timeframes. That kind of reproducible analysis is crucial when debates over inflation’s impact hinge on whether people are reacting to current monthly changes or to the full run-up in prices over several years.
Ultimately, the story behind the 25 percent figure is straightforward but sobering. The pace of grocery inflation has cooled and now resembles something closer to the pre-pandemic norm, yet households are living with a permanently higher cost baseline. Unless food prices were to fall outright-a rare occurrence in modern CPI history-the gains of the early 2020s will remain embedded in every supermarket trip. For families whose incomes have not kept up, the math at the checkout line is less about economic abstractions and more about what has to be left out of the cart.
Free for readers: The free Retirement Shield newsletter sends plain-English help keeping more of your money in retirement — the scams to dodge, the benefits you’re owed, and what’s changing with Social Security and Medicare, a couple times a week. Get the free newsletter.