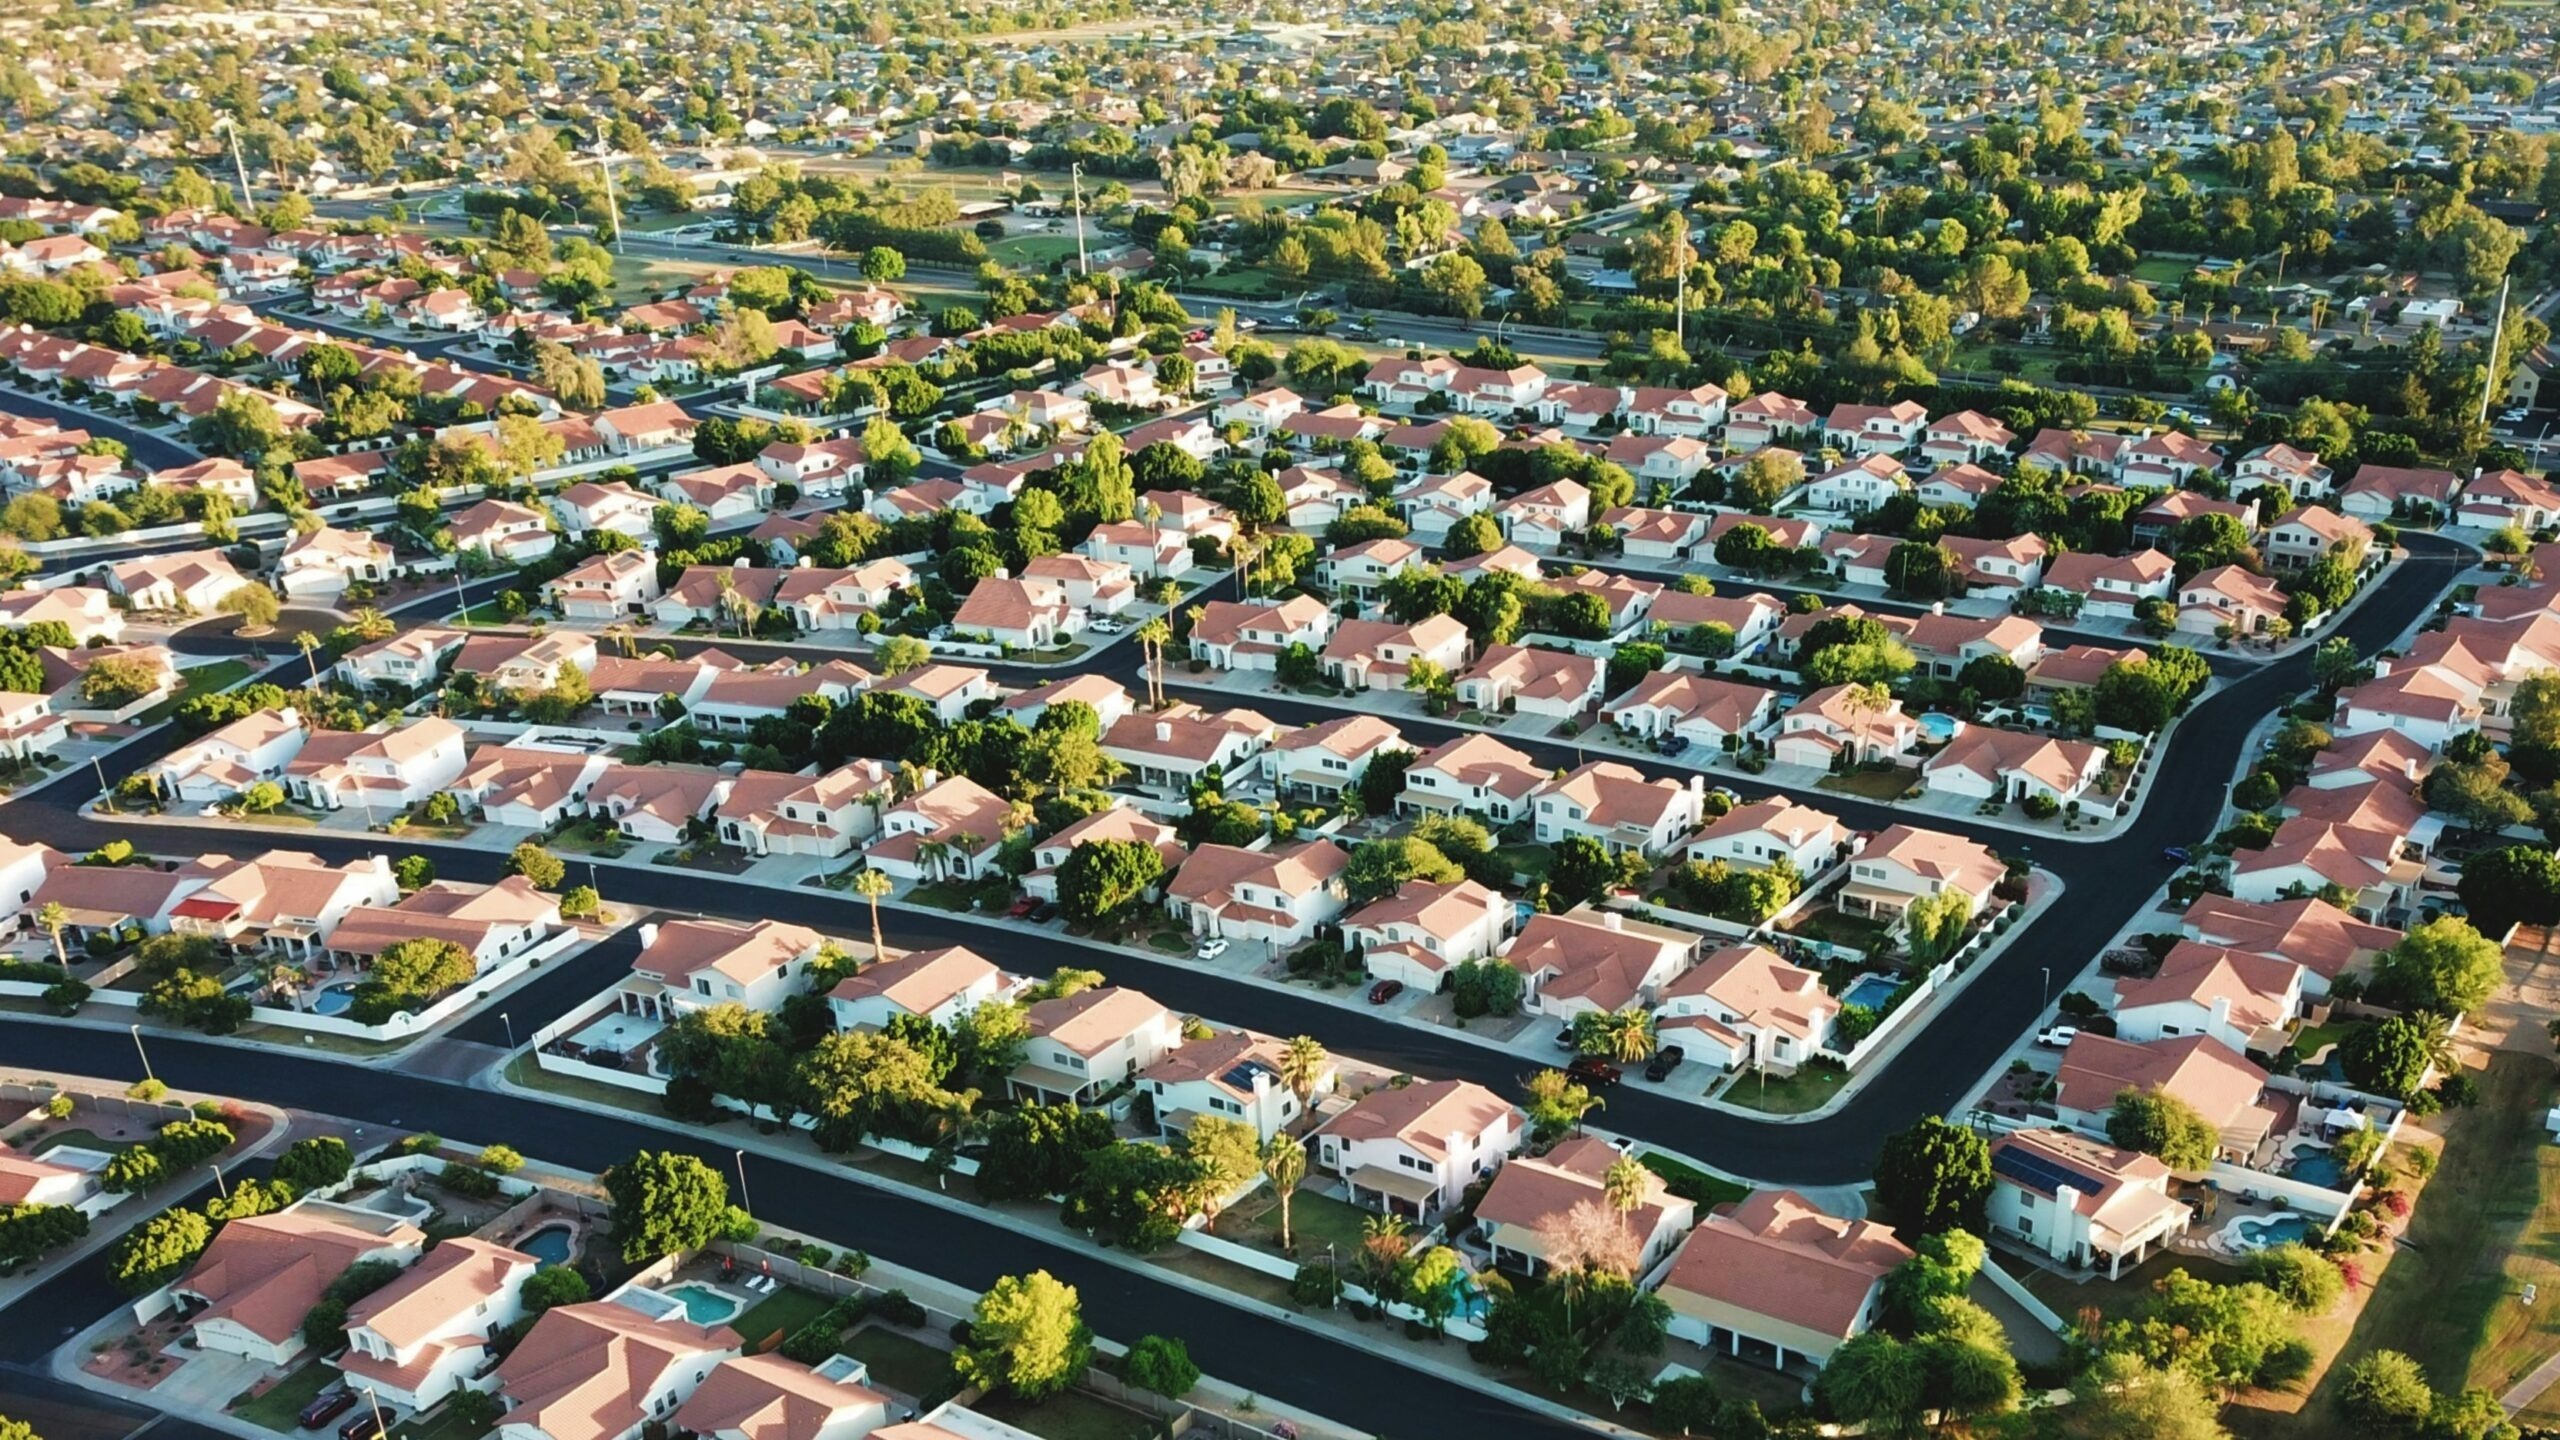
Buyers shopping for a home in mid-2026 are finding something they have not seen in years: asking prices that sit 2.5 percent below where they stood a year earlier, according to listing-level data. At the same time, the federal government’s own sales records show supply measures for new homes climbing while median transaction prices hold flat. The gap between what sellers want and what buyers will pay is widening, and the standoff is leaving inventory to stack up across the country.
Rising supply and flat sale prices are squeezing sellers
The 2.5 percent year-over-year decline refers to asking prices on active listings, not closed transactions. That distinction matters because the federal benchmark for completed sales tells a different story. The national median series published by the Federal Reserve Bank of St. Louis, drawing on U.S. Census Bureau and HUD data, tracks the quarterly median sales price of houses sold. Recent quarterly readings from that series have stayed relatively flat even as list prices drifted lower, which means sellers are cutting sticker prices to attract attention but actual closing prices have not dropped at the same pace.
That mismatch creates a specific risk. When asking prices fall faster than transaction prices, it signals that motivated sellers are competing for a shrinking pool of qualified buyers. If the trend continues and Census new-home supply measures keep climbing while MSPUS medians remain stagnant, final transaction prices could decline an additional 3 to 4 percent before enough inventory clears to restore balance. That projection depends on mortgage rates staying near current levels and no sudden shift in employment data, but the directional pressure is clear.
For individual homeowners, the dynamic can feel counterintuitive. Sellers see headlines about “softening prices” and assume buyers will quickly snap up anything that is discounted. Instead, many shoppers are stretching affordability limits after several years of rapid appreciation and higher borrowing costs. They are more selective, willing to walk away from homes that do not check enough boxes, and increasingly inclined to wait for further markdowns or builder incentives. That behavior reinforces the gap between list prices and what buyers are ultimately prepared to pay.
What the April 2026 HUD and Census data show
HUD and the Census Bureau released their April new-home report for 2026, which includes median and average sales prices for new houses sold alongside sales volume and months-of-supply figures. The report confirmed that supply measures have been edging higher, a pattern consistent with builders completing homes faster than buyers are signing contracts. Months of supply is a standard gauge of how long it would take to sell every new home on the market at the current sales pace, and rising readings point to a buyer’s market forming in the new-construction segment.
The same HUD and Census pipeline feeds additional datasets hosted across federal platforms, including construction statistics tracked by the Census Bureau. Together, these records show that the slowdown is not limited to resale listings. New-home transactions are also losing momentum, which means builders may soon face pressure to cut base prices or increase concessions to move standing inventory. Incentives can take the form of rate buydowns, closing-cost credits, or upgrades offered at little or no extra charge, all of which effectively reduce the net price without immediately pulling down headline medians.
Builders face a strategic choice in this environment. They can hold list prices steady and lean on incentives to protect reported values, or they can reset prices lower to accelerate sales and clear backlogs. The April data suggest many are still in the first camp, but if months of supply continue to rise into the second half of 2026, more aggressive price reductions are likely to follow.
Gaps in the data and what to watch next
Several questions remain open. The MSPUS series provides only quarterly national aggregates, so it cannot reveal whether certain regions are absorbing inventory faster than others or whether specific price tiers are softening more sharply. Monthly list-to-sale price ratios for 2026 are not available in the federal dataset, which limits the ability to track how quickly the asking-price decline is translating into lower closing prices in real time.
The HUD and Census releases also contain no direct data on buyer wait times or offer rejection rates, two metrics that would help gauge how aggressively purchasers are holding out for deeper discounts. Without regional inventory turnover figures, the national “pile-up” framing rests on aggregate supply measures that may mask local exceptions. Some metro areas with strong job growth or severe construction constraints could still see relatively tight markets even as the national numbers tilt toward surplus.
Researchers and market participants looking to fill in those gaps often turn to supplementary federal resources. The policy and data tools compiled on the HUD User portal can help analysts connect national sales figures with local affordability trends, rental conditions, and development pipelines. Combining those resources with private listing feeds and mortgage-rate trackers offers a more complete view of how quickly the current standoff between buyers and sellers might resolve.
For now, the direction of travel is clear even if the precise timing is not. Asking prices are drifting lower, new-home supply is building, and median sale prices have yet to fully adjust. Whether the market glides into a modest correction or slides into a deeper downturn will depend on how quickly buyers return, how firmly builders and homeowners hold the line on pricing, and whether broader economic conditions stay stable enough to support demand. Until those pieces come into better focus, both sides of the transaction are likely to remain cautious, and inventory will continue to tell the story.