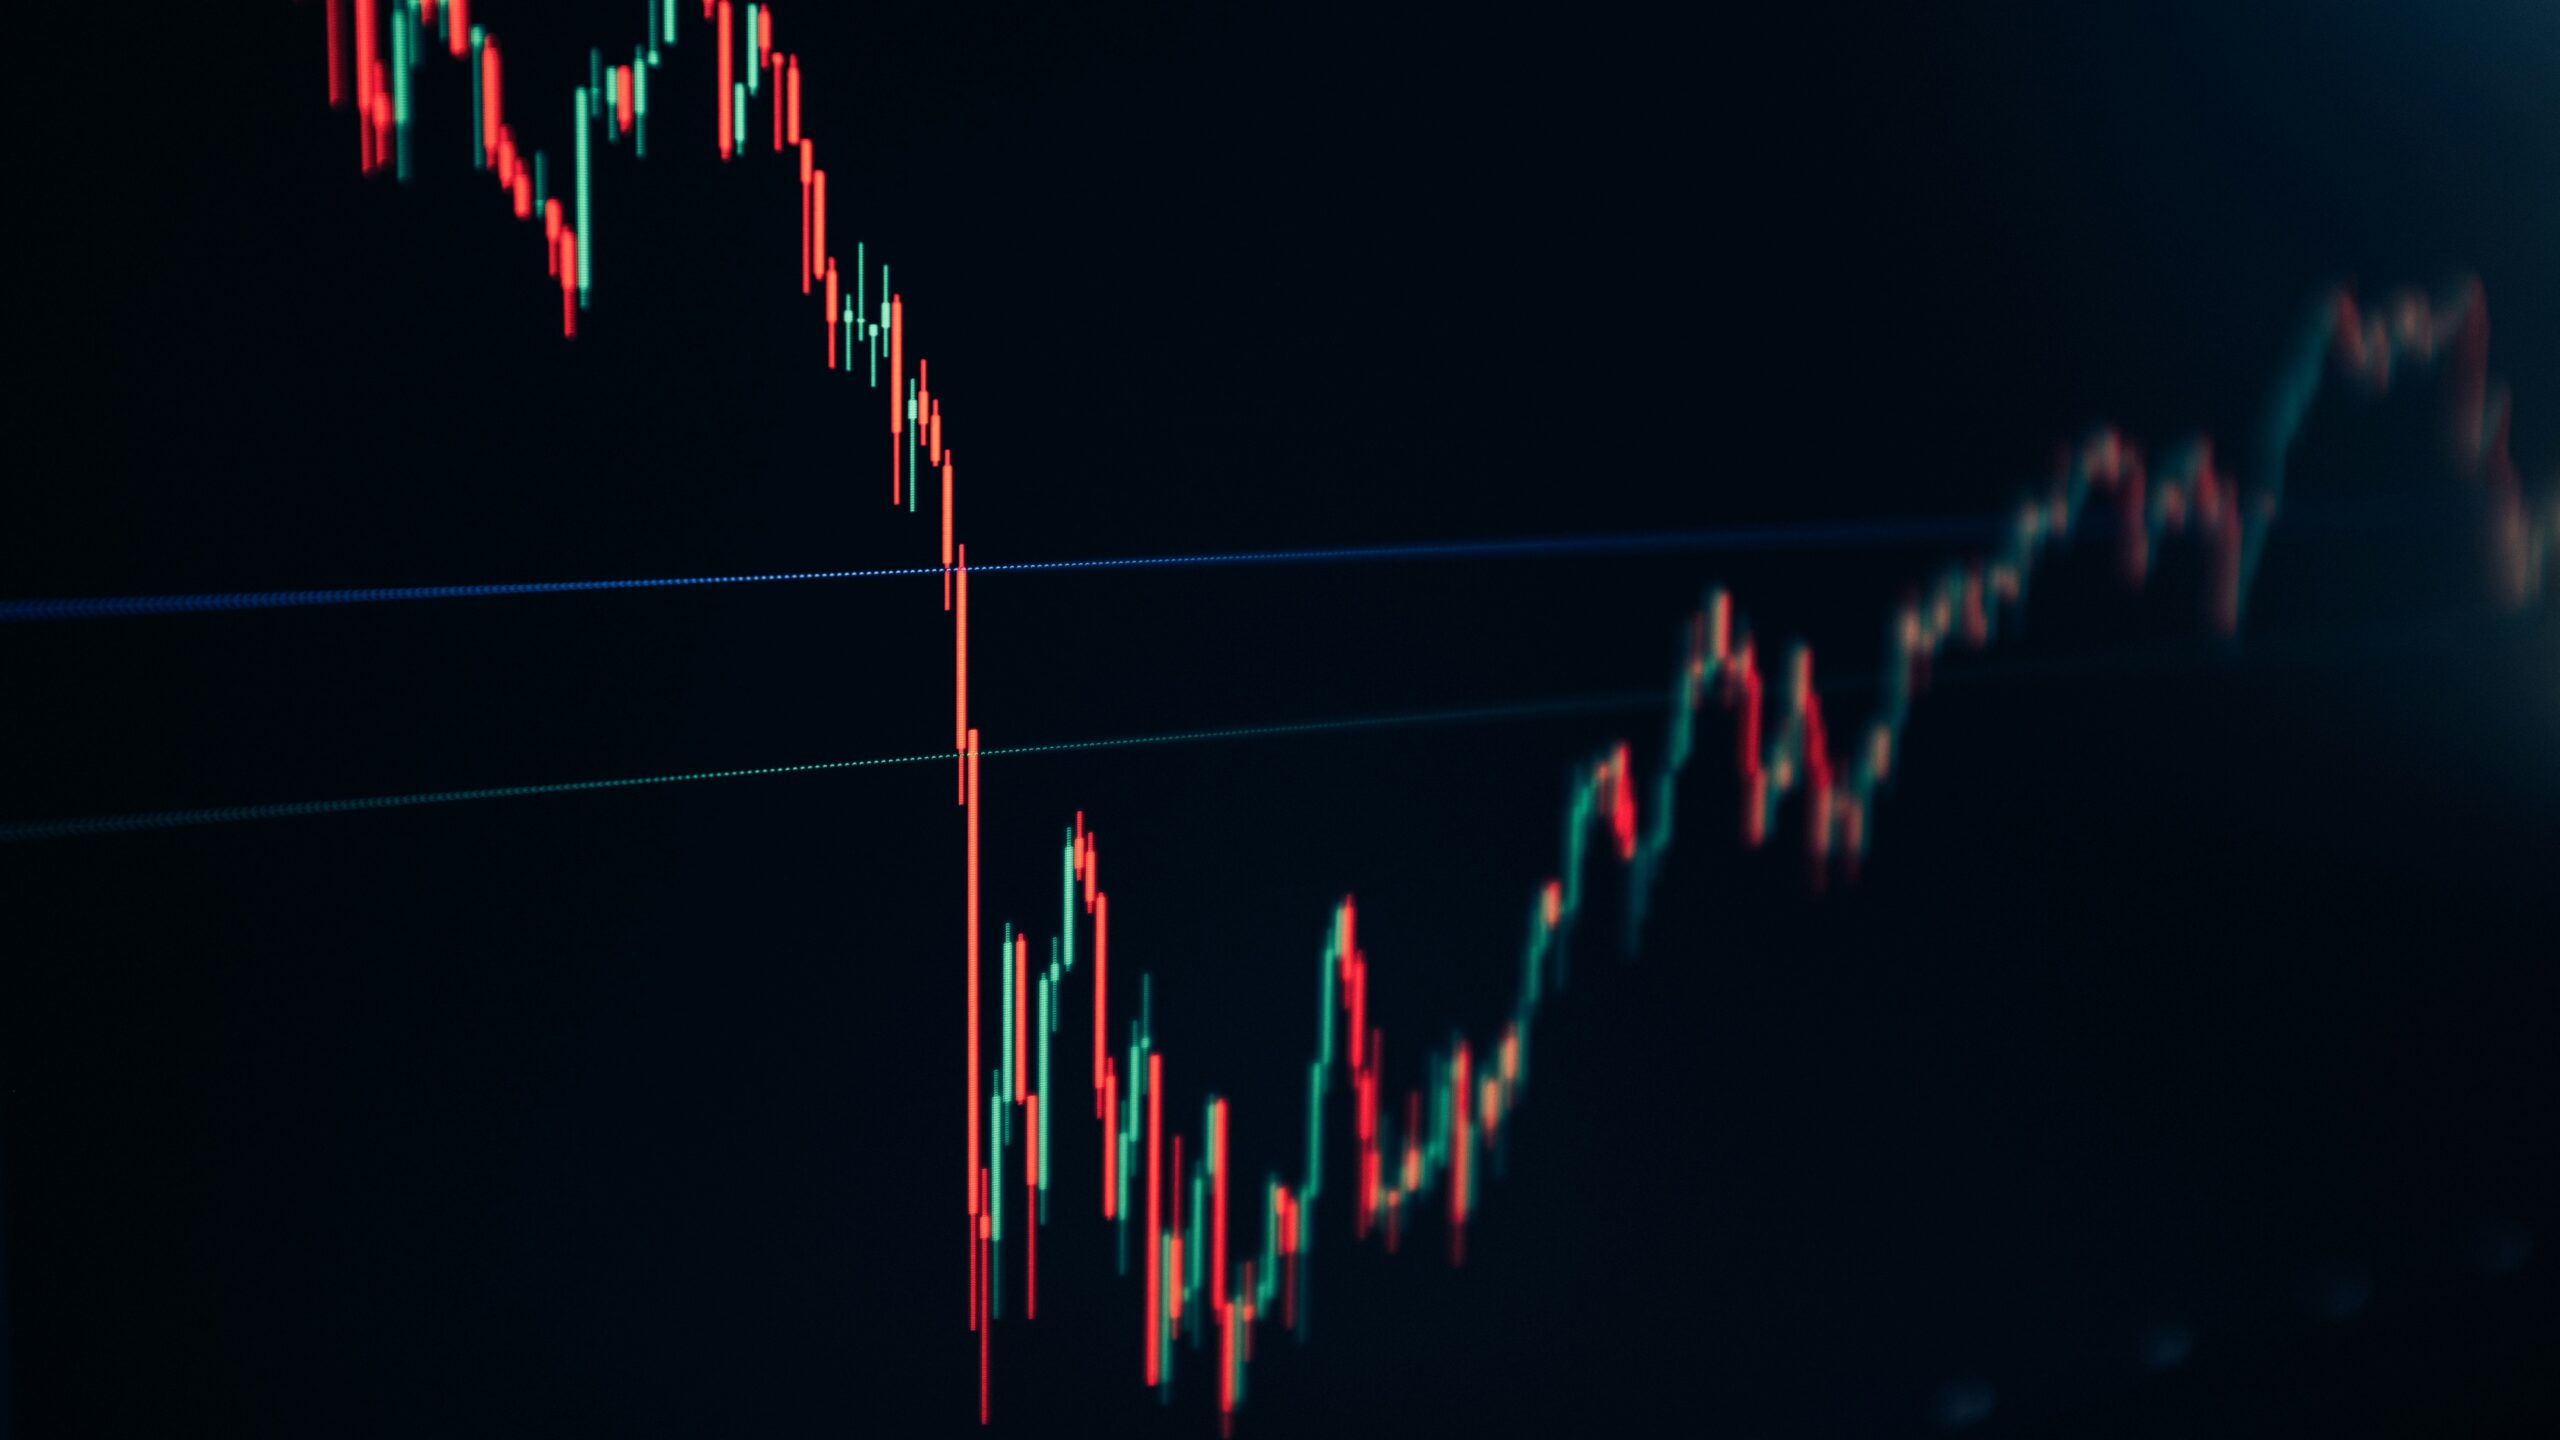
The 30-year Treasury bond closed at a yield of 5.12 percent on Friday, May 15, 2026, according to the U.S. Department of the Treasury’s daily par yield curve. That marks the highest daily close for the long bond since May 2025, confirmed by the Federal Reserve’s FRED DGS30 series. For homebuyers, corporate borrowers, and taxpayers footing Washington’s interest bill, the message from the bond market is blunt: long-term rates are not heading lower anytime soon.
The move did not come out of nowhere. Two government inflation reports released earlier in the week showed price pressures running hotter than forecasters expected, and by Friday afternoon, bond traders had repriced the outlook. Across Wall Street trading desks, the shorthand for the new consensus is “higher for longer,” a bet that elevated rates could persist well into 2027.
Back-to-back inflation reports rattled rate-cut hopes
On Monday, the Bureau of Labor Statistics published its Consumer Price Index report for April. The headline numbers came in above the consensus forecast compiled by major wire services, with energy costs flagged as a significant contributor to the monthly increase. The annual rate of consumer inflation remained well above the Federal Reserve’s 2 percent target.
The following day, the BLS released its Producer Price Index for April, which showed wholesale-level prices still elevated across a broad range of commodity and service categories. Producer prices matter because they capture cost pressures at the factory gate and the loading dock before those increases filter into grocery aisles and gas pumps. Together, the two reports gave bond traders a clear, two-day signal: the Fed has little room to cut.
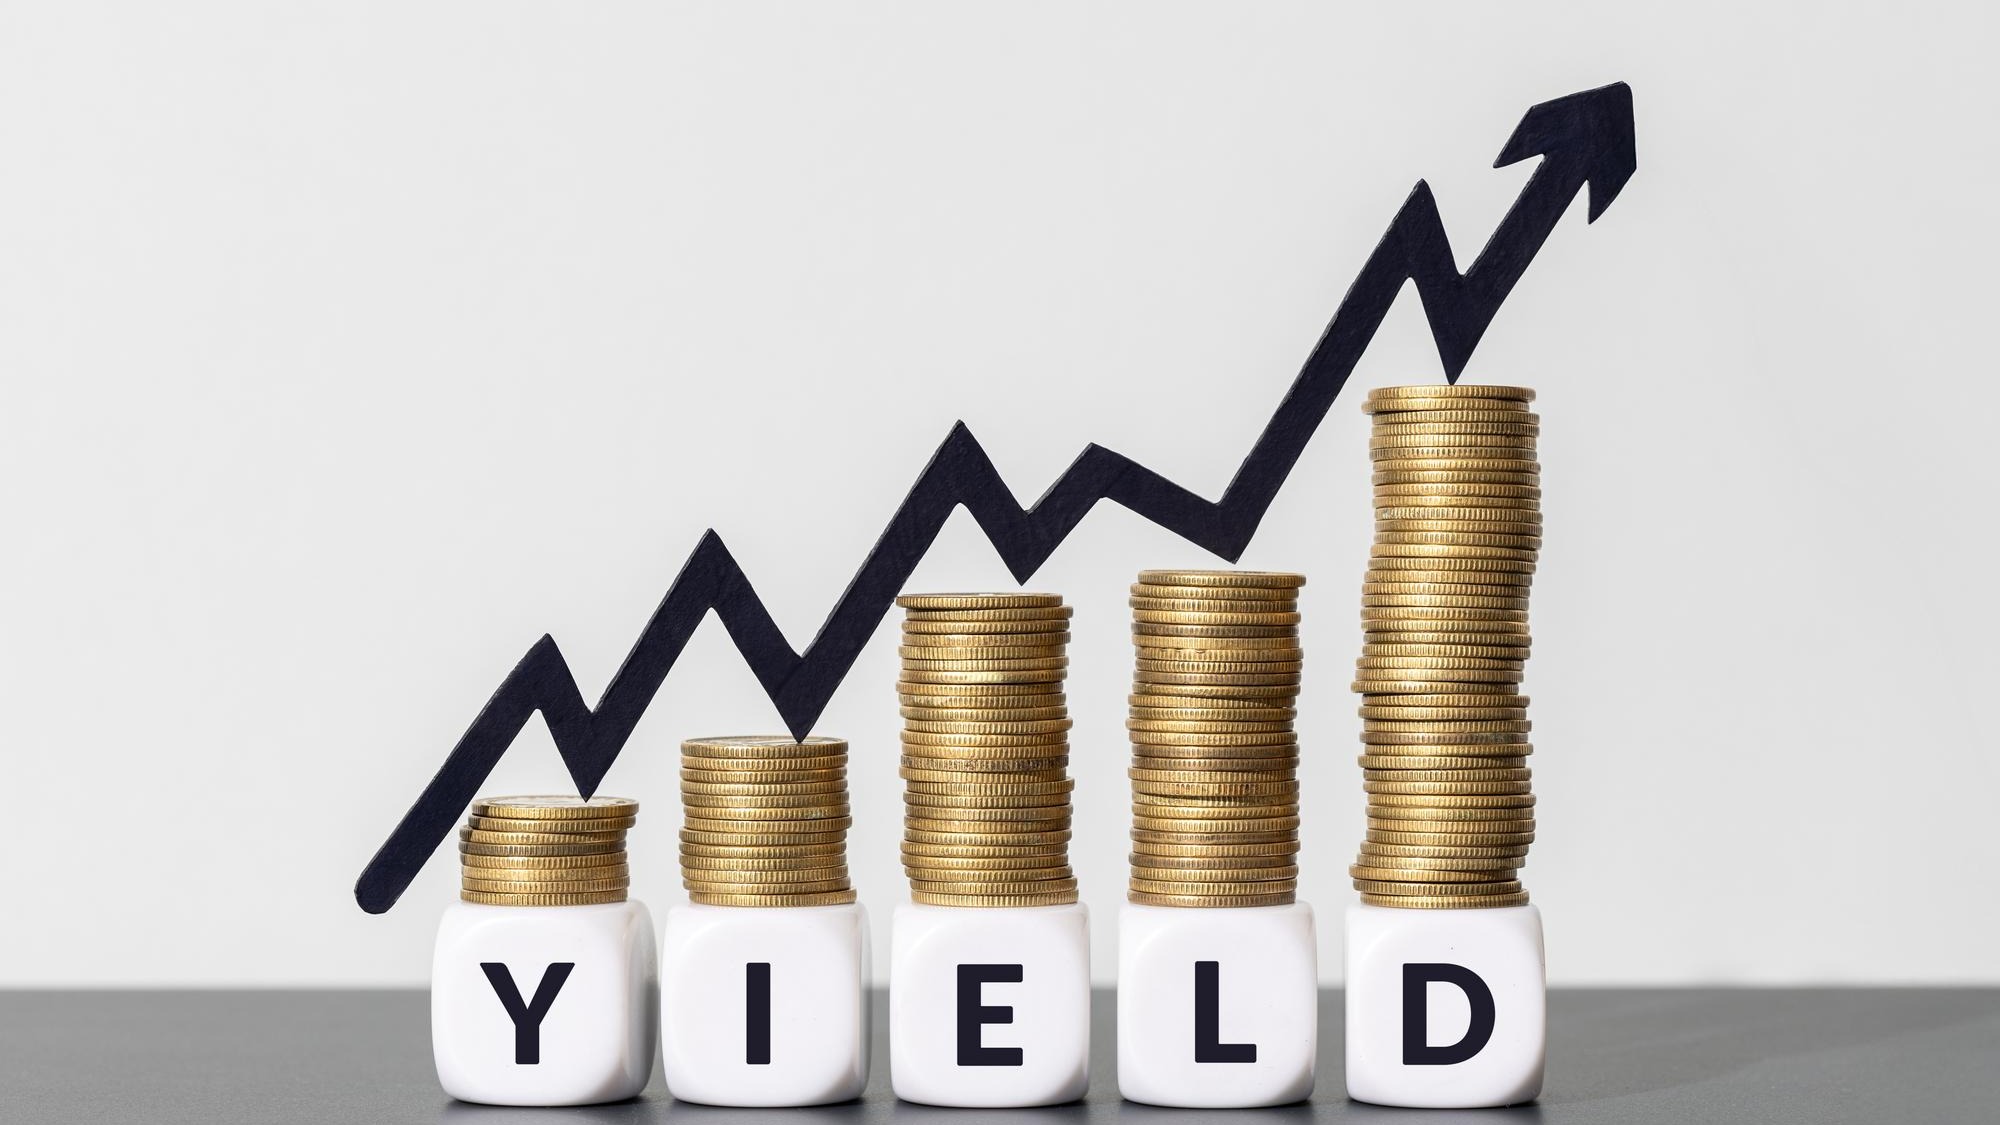
How far the 30-year yield has climbed
To appreciate the scale of the move, consider the starting point. The 30-year yield opened 2026 near 4.6 percent. It has now risen more than half a percentage point in roughly five months, a grind higher that stands out in a market where moves of a few basis points can shift billions of dollars in bond valuations.
The 10-year Treasury note, which serves as the benchmark for a wider range of borrowing costs, has tracked a similar path upward, reinforcing the idea that the entire long end of the yield curve is repricing. Mortgage lenders, corporate treasurers, and the U.S. Treasury itself all borrow at rates that take their cue from these benchmarks.
What rising yields mean for mortgage payments
The 30-year fixed mortgage rate does not move in lockstep with the 30-year Treasury yield, but the two are closely correlated. When long-bond yields rise, mortgage lenders widen the rate they charge to compensate for the added risk of holding loans over decades of potentially elevated inflation. Freddie Mac’s Primary Mortgage Market Survey is the standard weekly gauge of where those rates land.
A practical example shows why the shift matters. On a $400,000 home loan, the difference between a 6.5 percent mortgage rate and a 7.2 percent rate adds roughly $300 to the monthly payment and more than $100,000 in total interest over the life of the loan. For first-time buyers already stretched by elevated home prices, every quarter-point increase in mortgage rates pushes affordability further out of reach.
Washington’s ballooning interest bill
The federal government is feeling the pressure, too. Total public debt outstanding now exceeds $36 trillion, according to the Treasury Department’s Debt to the Penny tracker, and a rising share of that debt must be refinanced at today’s higher yields. The Congressional Budget Office has projected that net interest payments are on track to become one of the largest single line items in the federal budget, rivaling defense spending within the next several years. Weeks like this one accelerate that timeline.
Higher debt-servicing costs also feed back into the bond market itself. Investors who worry that Washington will need to issue even more debt to cover its interest payments may demand still-higher yields as compensation. Fiscal analysts have warned about this self-reinforcing loop for years; a sustained move above 5 percent on the long bond brings it closer to reality.
The Fed’s silence speaks volumes
Notably absent from this week’s action: any on-the-record comment from the Federal Reserve. No Fed governor or regional bank president publicly characterized the yield move as evidence of a structural shift. The phrase “higher for longer” remains a market narrative, not a policy statement. The Federal Open Market Committee’s next scheduled meeting is in June, and until then, traders are operating without official guidance.
That silence cuts both ways. It may signal that the Fed views the bond selloff as an orderly repricing that effectively does some tightening work on its behalf, reducing the need for additional rate hikes. Or it may simply mean policymakers are still digesting the same data as everyone else. Either way, the market is setting the tone, and right now that tone is decidedly hawkish.
Three tests that will shape the rate outlook through June
Whether this week’s yield spike hardens into a lasting regime or fades as a short-term overreaction depends on three things in the weeks ahead.
The May CPI report, due in mid-June, will reveal whether April’s elevated inflation reading was a one-month flare driven by energy prices or the start of a broader reacceleration. A second consecutive hot print would make it very difficult for the Fed to justify rate cuts this year.
The Fed’s June meeting will produce an updated Summary of Economic Projections, including the closely watched “dot plot” of rate forecasts. If officials pencil in fewer cuts for 2026 than they signaled in March, the bond market’s higher-for-longer bet gains official backing.
The Treasury’s quarterly refunding announcement will show how much new long-term debt the government plans to sell. Heavy issuance at a time when demand for duration is already soft could push yields higher still.
There is a counterargument worth noting: if the economy slows sharply or a financial stress event triggers a flight to safety, long-term Treasuries could rally and yields could fall. Bond bears have been wrong before. But as of mid-May 2026, the weight of the evidence points in one direction. Long-term rates sit at their highest point in a year, pushed there by inflation that has not cooled as quickly as borrowers, buyers, and budget planners had hoped. The bond market has placed its bet. The next round of data will determine whether it pays off.