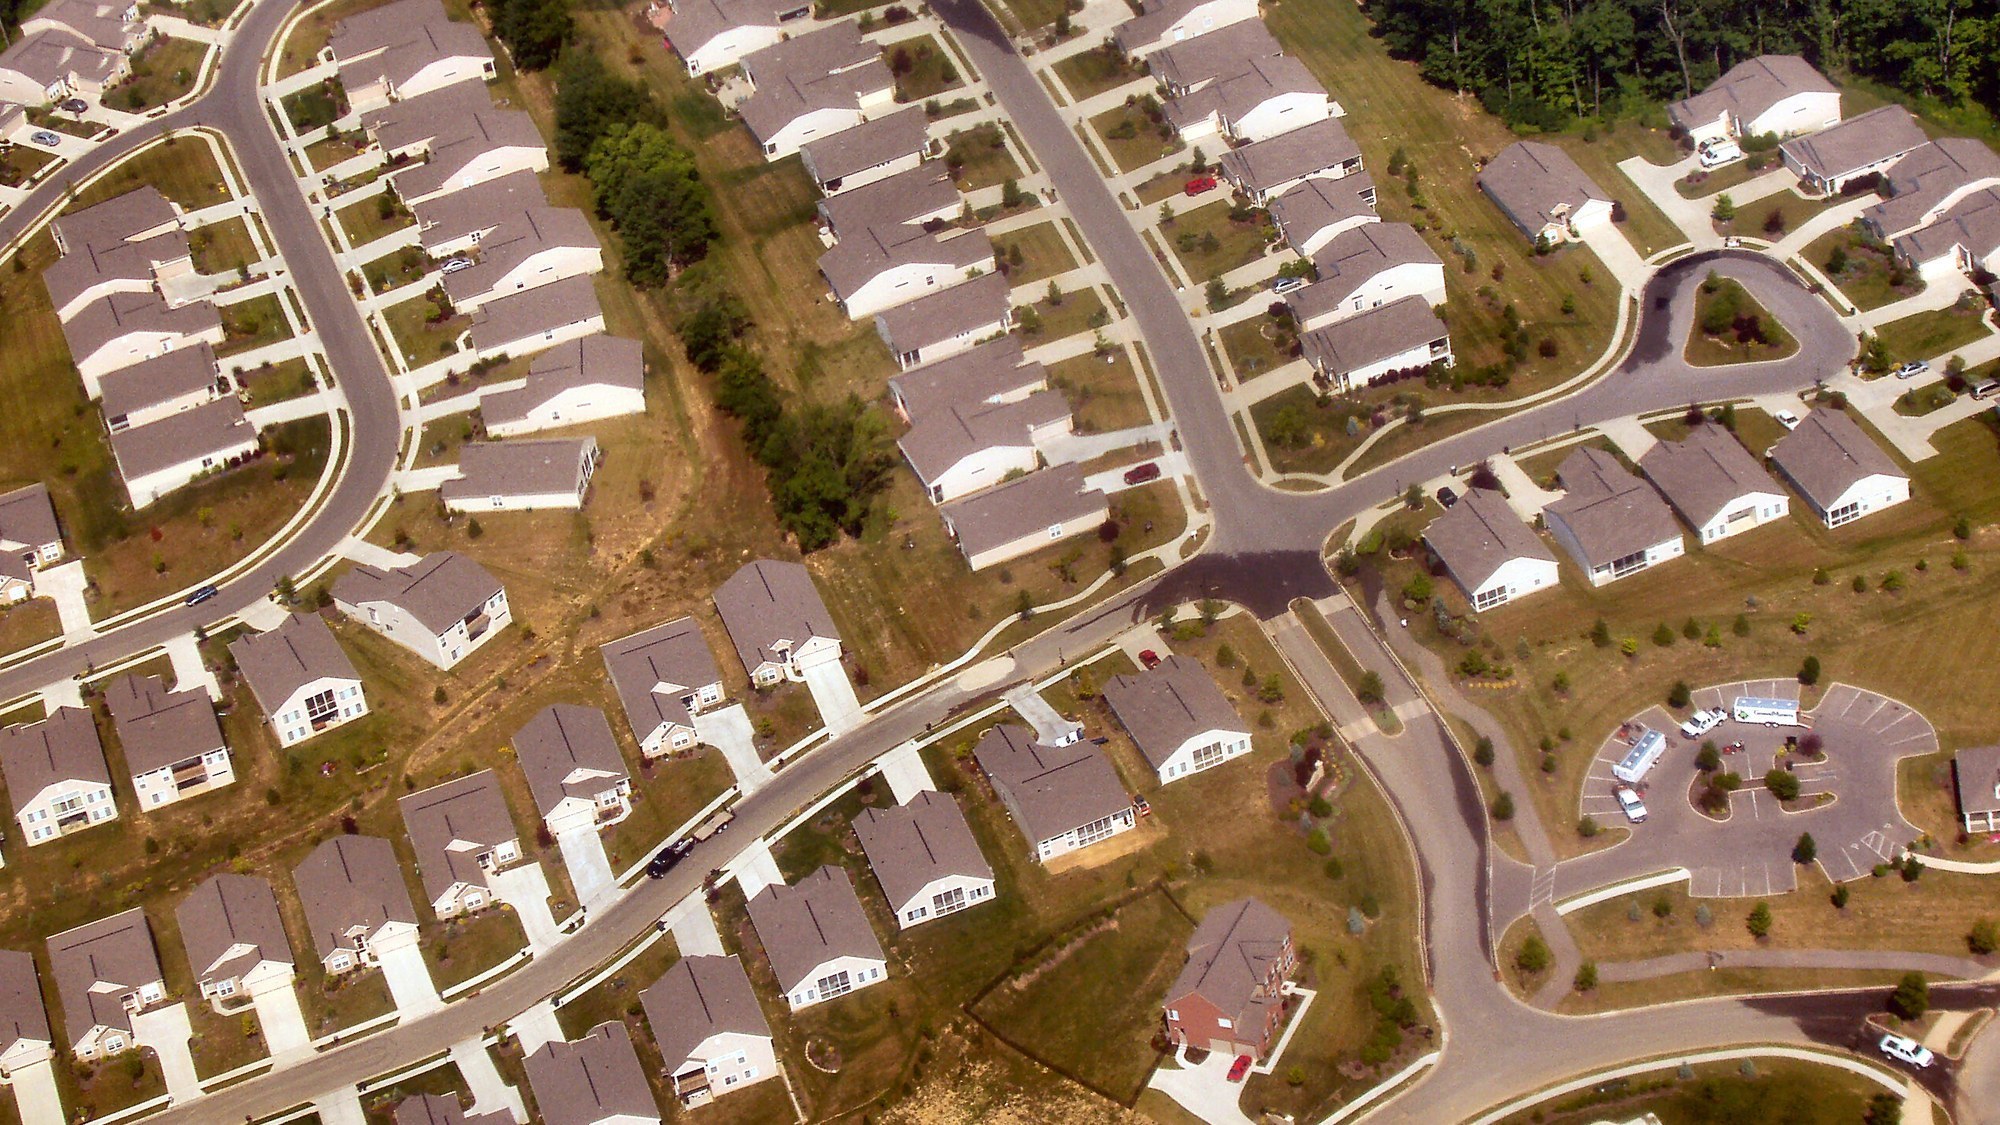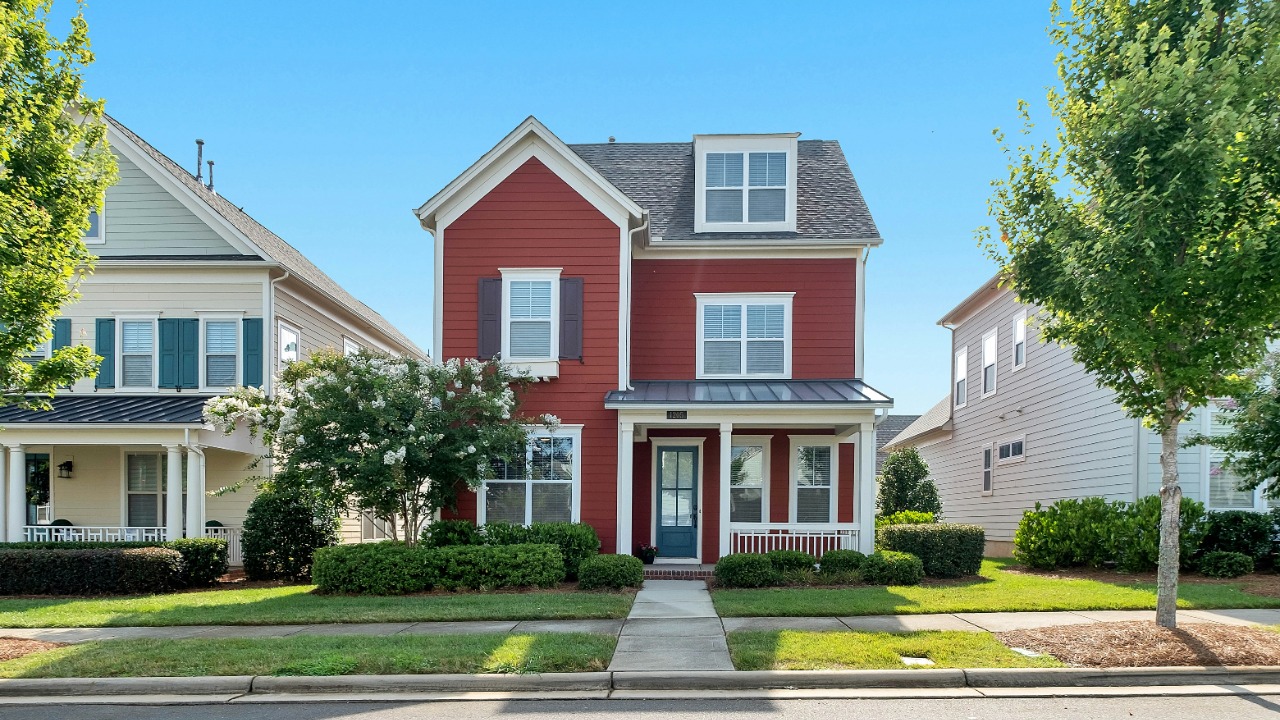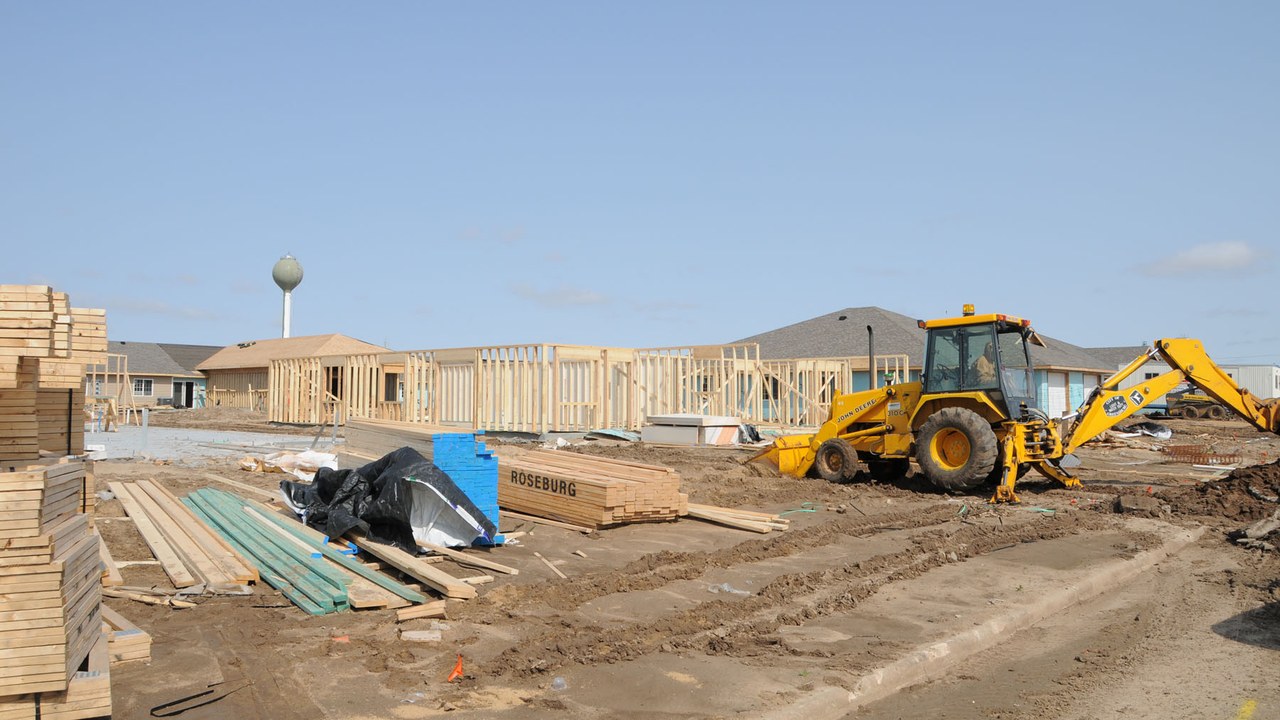
Local governments authorized single-family homes at a seasonally adjusted annual rate of 845,000 in September, down 4.0% from a revised 880,000 in August, the Census Bureau says. Permits are the first formal step before a house is built, so a falling count is an early warning about how many homes will be for sale in the year ahead. Total permits, including apartments, barely moved.
A 35,000-home drop in one month
The Census release puts total permits at 1,400,000, down 0.2% from a revised August figure of 1,403,000 and 3.0% below September 2025. The single-family slice fell much faster than the whole. Single-family authorizations lost 35,000 homes of annual pace in one month, while the total slipped by only 3,000.
The National Association of Home Builders (NAHB), an industry group that analyzes the Census data, adds the yearly view. In its write-up, single-family permits are down 4.8% from September 2025. Apartments and other multifamily permits ran at 555,000, up 6.1% from August, which is why the overall number looked flat.
In plain terms, permit offices handed out fewer approvals for the kind of house a retiree might buy to downsize, a grandchild might buy to start a family, or an investor might buy to rent. Meanwhile approvals for rental buildings picked up. The mix being planned is tilting toward rental buildings.
Retirement deadlines, in your inbox: Miss an enrollment or claim deadline and the money can be gone. Join the Retirement Money Brief and we’ll send you our 2026 Government Check Reality Tracker as a welcome gift.
Get the Brief + the check tracker →
We may earn a commission from links on this page.
Where builders pulled back, and where homes are still being approved
The full release tables break the 845,000 into regions. The South accounted for 505,000 single-family permits, the West for 170,000, the Midwest for 121,000 and the Northeast for 49,000. The South alone held about 60% of the national pace.
Census issued the figures on October 20 in its monthly new residential construction report. Total permits, all housing types combined, followed the same order: 759,000 in the South, 283,000 in the West, 213,000 in the Midwest and 145,000 in the Northeast. In the Northeast, only 49,000 of 145,000 permits were for single-family homes, a far smaller share than in the South, where 505,000 of 759,000 were.
Census reports permits for buildings with five or more units separately, at 503,000 for September. It gives no margin of error for the permit figures, unlike its starts and completions estimates, which carry margins of roughly 10% or more.
Permits are a plan, not a house. Census also counts what has been approved but not yet started. At the end of September, 279,000 units sat in that category, 151,000 of them single-family, including 93,000 in the South and 32,000 in the West. Builders can sit on a permit when conditions look shaky.
Why builders are slowing single-family plans
NAHB attributes the weakness to persistent housing affordability pressures. Its analysis points to higher financing costs, building material costs and ongoing labor shortages as the squeeze on builders.
The pullback shows up further down the line too. Builders broke ground on single-family homes at an 859,000 annual rate in September, down 4.6% from August and the lowest in a year, NAHB says. Single-family units under construction stood at 587,000, down 2.8% from a year ago.
Taken together, permits, starts and units under construction all point the same way for single-family housing. A buyer looking for new construction next spring will find fewer homes in the pipeline than the same buyer would have found a year earlier.
What fewer new houses mean for people buying or staying put
Fewer new houses can mean more competition for the homes that already exist. That matters to people who plan to sell a long-held home and need somewhere to land, and to those on fixed incomes who watch each rise in rent, insurance and property taxes. Census does not say how prices will react.
Most households are not shopping for new construction at all. The Federal Reserve’s 2025 Survey of Consumer Finances, released October 9, puts homeownership at 66%, roughly unchanged, with the median net housing value of homeowners at $230,000, up from $218,900 in 2022. For them, the permit count matters through what it does to resale prices.
Census estimates carry sampling error, and the agency warns that preliminary numbers get revised. On average the preliminary figures for permits, starts and completions are revised by 3.8% or less. The 4.0% monthly drop is larger than that typical revision, and August itself was revised in this report.
The next report covers October and is due November 18. It will show whether the September drop was a one-month dip or the start of a longer slide in single-family approvals. Anyone timing a purchase or a sale will want that number before deciding, because permit counts move ahead of both new-home supply and the prices that follow.
Most of the cost pressure that comes with housing sits outside the purchase price. Property taxes, utilities and heating bills keep arriving regardless of what permit offices approve. Several programs offset them for older households, including property-tax relief and heating assistance, and each one has to be applied for.
Buying or selling soon, with fewer new houses coming?
Fewer single-family permits point to tighter supply, and tighter supply leaves the costs of owning, from property taxes to heating bills, doing most of the damage on a fixed income. A buyer or seller can plan around a price. Programs that offset the carrying costs have to be applied for, and each has its own income limit.
The Benefits Checklist scans 11 benefit programs, including property-tax breaks and heating help, with the 2026 income limits and a 50-state phone directory in one place. The permit data cannot say which help a household is missing; this kit finishes that related job and comes with a printable application tracker.
See which of 11 cost-relief programs fit a household, with the Benefits Checklist →
More Financial Reading
- 21 Ways to Stretch a $2,087 Social Security Check
- 15 Places to Find Your Share of the $4.25 Billion States Give Back
- The New $6,000 Senior Deduction and 14 More Tax Moves for Retirees
This article was produced with AI assistance and edited for accuracy against the sources linked above.